Tesla (TSLA) has surged approximately 66% in four weeks after finding strong support at $234–$240.
The stock has broken through key Fibonacci resistance at $319.50, indicating bullish momentum.
There is potential for an additional 13% upside towards the Golden Ratio resistance at $393, which could lead to a retest of the all-time high at $488.50.
Near-term support levels are identified at $301 and $265, with mixed momentum signals suggesting cautious optimism.
Tesla (TSLA) has staged a remarkable rally over the past four weeks, rebounding sharply after tapping into key Fibonacci golden ratio support that held with conviction. With bullish momentum accelerating and technical structure firming up, the question now is whether this bullish bounce has more runway to the upside.
Tesla Stock Skyrockets 66% in Just 4 Weeks: What’s Driving the Rally?
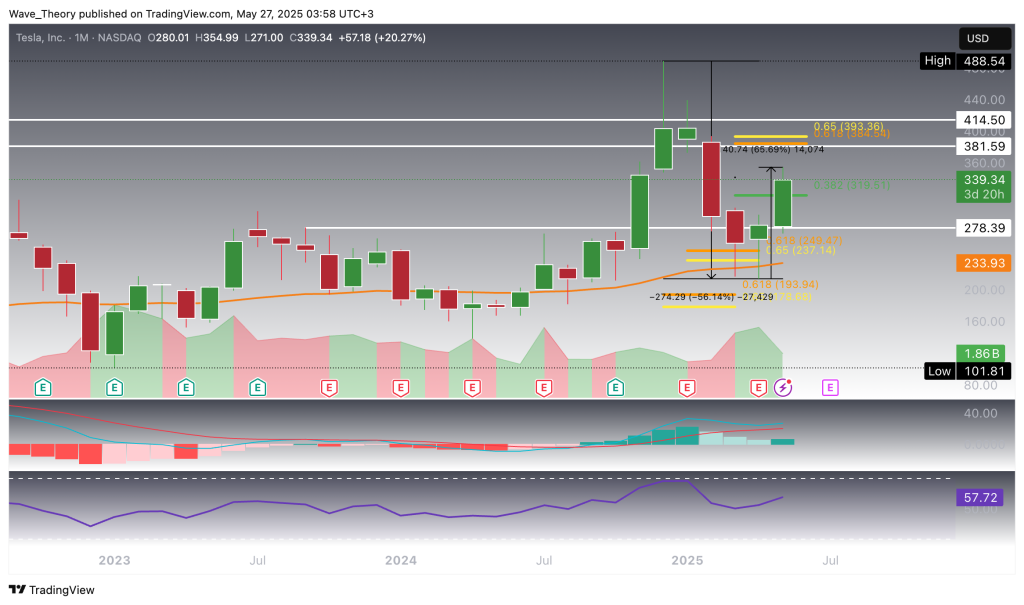
After a steep decline from $488.50 to $214, Tesla (TSLA) found strong confluence support at the 50-month EMA around $234 and the key Golden Ratio Fibonacci retracement level at $240. This technical base catalyzed an explosive reversal, with the stock surging approximately 66% in just four weeks. In the process, TSLA has decisively broken through the 0.382 Fibonacci resistance at $319.50. On the momentum front, the MACD histogram has begun to tick higher for the first time in three months, signaling a potential bullish shift. The MACD lines remain in a bullish crossover, while the RSI sits in neutral territory, indicating room for further upside without immediate overbought pressure.
Tesla
Tesla Stock Eyes Further Upside of 13%: Key Golden Ratio in Focus
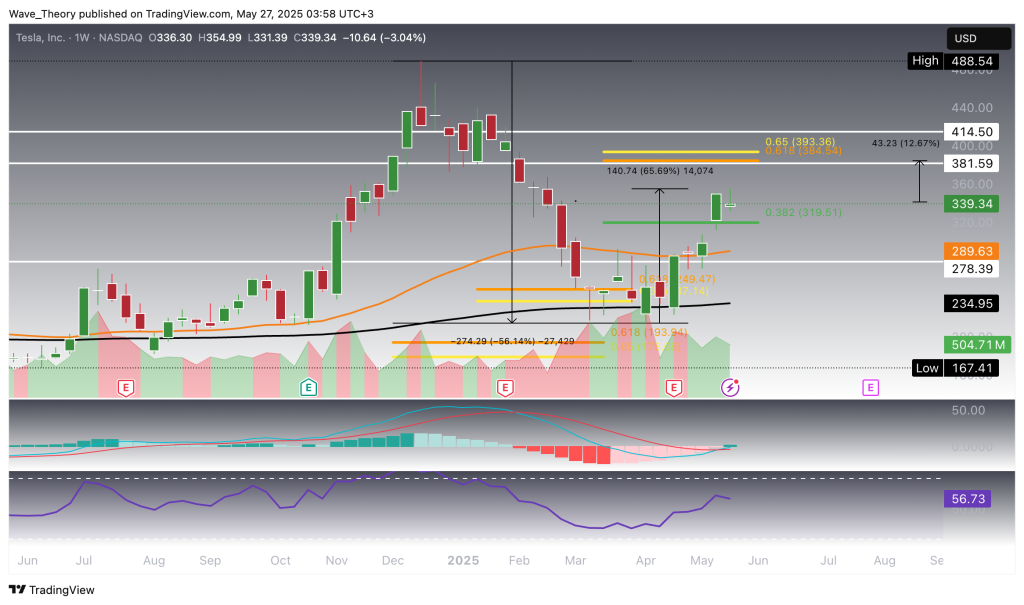
Tesla (TSLA) could see an additional 13% upside, targeting the crucial Golden Ratio resistance at $393. A decisive break above this level would mark the end of the ongoing corrective phase and confirm a reentry into Tesla’s broader uptrend structure. Technically, the momentum landscape is increasingly supportive: the MACD lines have formed a bullish crossover on the weekly timeframe, while the histogram continues to trend higher—indicating strengthening upward momentum. Moreover, the EMAs display a golden crossover, confirming the trend bullishly in the mid-term. The RSI remains in neutral territory, leaving ample room for continuation. Should TSLA clear the $393 barrier, a run toward its all-time high at $488.50 becomes a realistic scenario.
Tesla
A Golden Crossover Has Emerged on Tesla’s Daily Chart: Bullish Signal With a Note of Caution
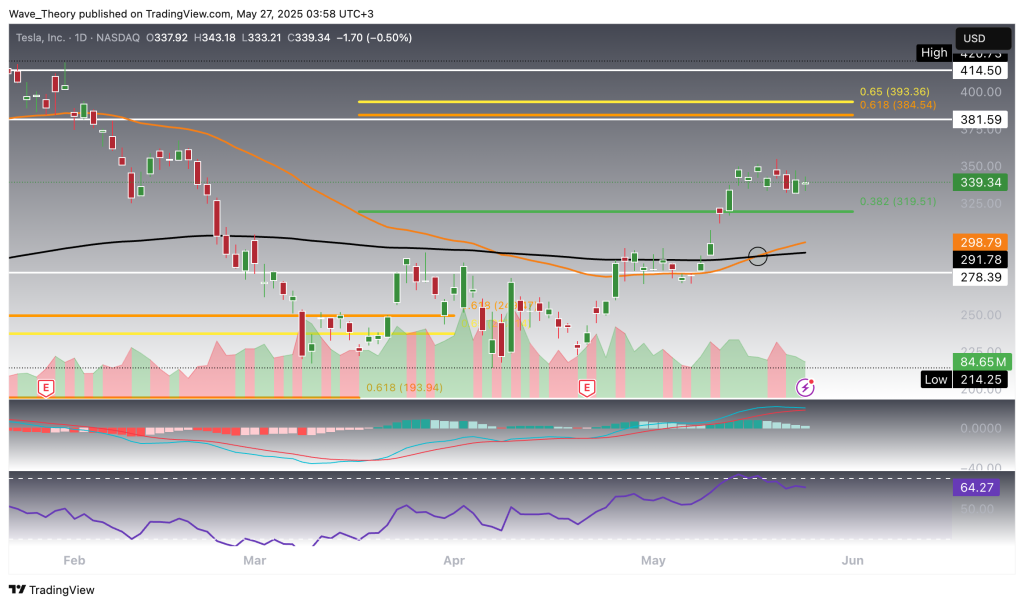
On the daily timeframe, Tesla (TSLA) has confirmed a golden crossover, with the 50-day EMA crossing above the 200-day EMA—an important bullish signal suggesting strength in the short- to medium-term trend. Supporting this view, the MACD lines remain in a bullish crossover configuration. However, it’s worth noting that the MACD histogram has been ticking lower for the past four days, signaling a potential loss of near-term momentum and warranting caution. The RSI remains directionless in neutral territory, offering no clear bias at this stage.
Tesla
Similar Outlook on the 4H Chart: Where Are the Next Support Levels for Tesla?
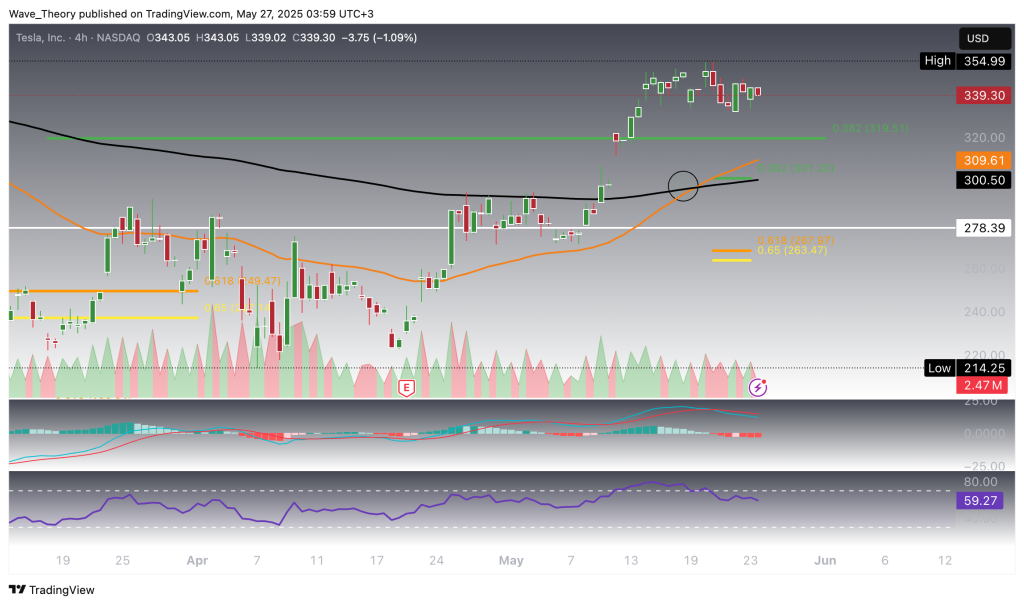
On the 4-hour chart, Tesla (TSLA) mirrors the bullish structure seen on the daily timeframe, with a golden crossover between the 50-EMA and 200-EMA confirming short-term upward trend momentum. However, a shift in near-term momentum is emerging: the MACD lines have crossed bearishly, and the histogram continues to tick lower—suggesting potential for a corrective phase. The RSI remains neutral, offering no immediate directional cues. Should a pullback occur, TSLA’s next key Fibonacci support levels lie at $301 and $265, offering potential zones for buyers to re-enter.
Tesla
Summary
Tesla (TSLA) remains in a strong recovery trend after bouncing off major support at $234–$240, with upside potential toward the key Golden Ratio resistance at $393; a breakout above this level could open the path to retest the all-time high at $488.50. Near-term support rests at $301 and $265, while momentum remains mixed across timeframes, warranting cautious optimism.
Konstantin Kaiser comes from a data science background and has significant experience in quantitative trading. His interest in technology took a notable turn in 2013 when he discovered Bitcoin and was instantly intrigued by the potential of this disruptive technology.