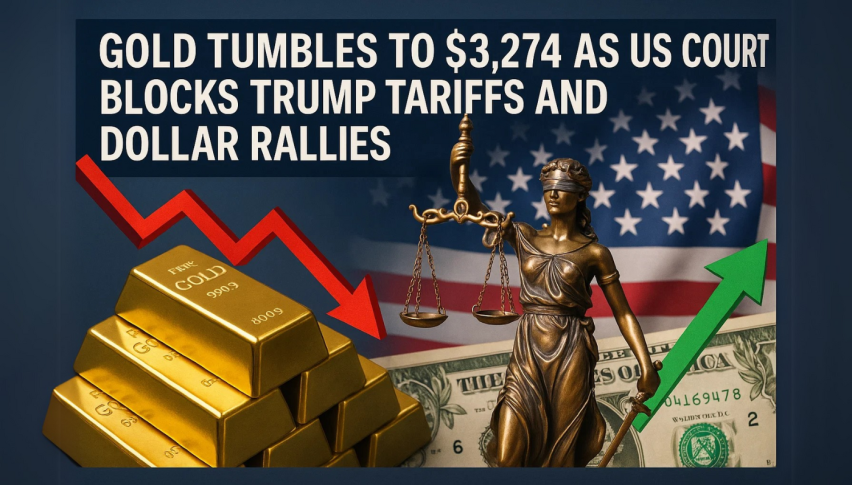
Gold Tumbles to $3,274 as US Court Blocks Trump Tariffs and Dollar Rallies
Gold (XAU/USD) took a hard hit on Thursday, tumbling to $3,274—its lowest level in over a week. The drop came right after a U.S. federal..
Quick overview
- Gold (XAU/USD) fell to $3,274, its lowest level in over a week, following a U.S. court's decision to block President Trump's tariffs.
- The ruling led to a dollar rally, making gold more expensive for global buyers and increasing selling pressure.
- Technical analysis shows a descending triangle pattern, with key support at $3,247 and potential targets for further declines at $3,210 and $3,171.
- Traders are monitoring upcoming U.S. GDP and inflation data, which could influence Federal Reserve policy and gold prices in the near term.
Gold (XAU/USD) took a hard hit on Thursday, tumbling to $3,274—its lowest level in over a week. The drop came right after a U.S. federal court blocked President Trump’s “reciprocal tariffs”, effectively pausing his plan for broad tariffs on trade-surplus nations. This court decision cooled gold’s status as a safe-haven asset, as traders turned to riskier bets with Wall Street futures and Asian equities rebounding.
According to Nicholas Frappell of ABC Refinery, “The court’s decision sparked a dollar rally, putting gold under pressure.” As the U.S. dollar index (.DXY) surged, gold became pricier for global buyers, adding to the downward pressure. Even though the Trump administration plans to appeal the ruling—possibly all the way to the Supreme Court—the immediate effect was a sharp selloff in gold prices.
Technical Breakdown: Key Levels to Watch
Gold’s chart is showing a classic descending triangle pattern, with resistance tightening near $3,398 and a solid base around $3,247. A clean break below this base could send prices sliding further to $3,210 or even $3,171.
Here’s a potential short setup for traders:
-
Short Entry: Below $3,247
-
Target 1: $3,210
-
Target 2: $3,171
-
Stop-Loss: Above $3,286
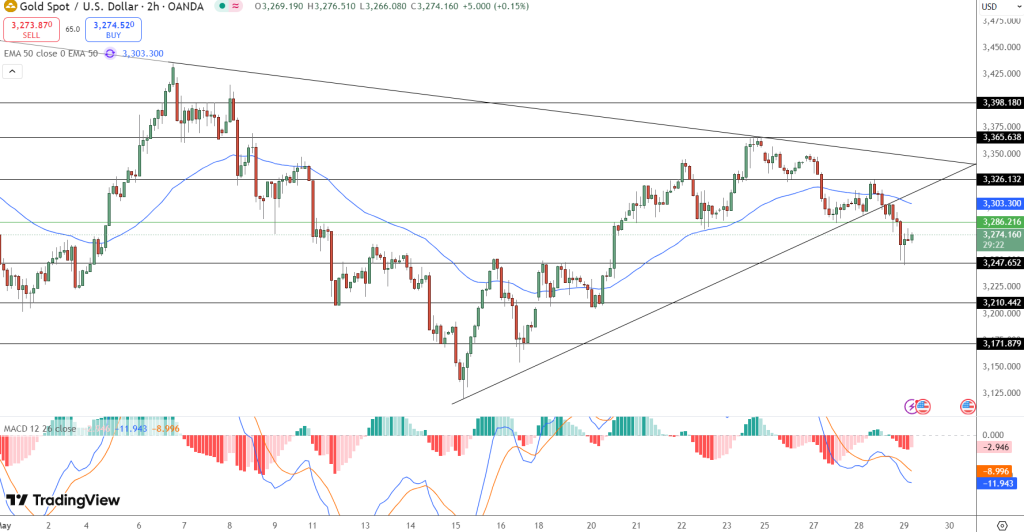
Technical signals are reinforcing the bearish tilt:
-
Multiple spinning tops and Doji candles near $3,274 show market indecision.
-
The MACD has turned bearish, with the histogram deepening into red.
-
The RSI is hovering around 50, showing a slight bearish lean.
A sharp drop below $3,247 could confirm the breakdown. However, if gold bounces back above $3,303, especially with a bullish engulfing candle, we might see a recovery push toward $3,326.
What’s Next: Key Data and Fed Moves
Looking ahead, traders are keeping a close eye on upcoming U.S. GDP data and core PCE inflation figures for clues on where the Federal Reserve might go next. The latest Fed meeting minutes revealed worries about both rising inflation and stubborn unemployment, suggesting that policymakers could soon face a tough choice between tightening or easing monetary policy.
Longer-term, Frappell sees potential for a weaker dollar and persistent inflationary pressures to support gold prices, despite this week’s sharp dip. But in the near term, the Trump tariffs saga and a stronger dollar are likely to keep gold’s upward momentum in check.
- Check out our free forex signals
- Follow the top economic events on FX Leaders economic calendar
- Trade better, discover more Forex Trading Strategies
- Open a FREE Trading Account
- Read our latest reviews on: Avatrade, Exness, HFM and XM
Related Articles


Sidebar rates
Related Posts
