Ethereum ETF Investors Face Heavy Losses as Price Correction Continues Below $2,650
Having dropped over 3% in the past 24 hours, Ethereum (ETH) is showing a clear correction and trading around $2,600. Technical indicators
Quick overview
- Ethereum has dropped over 3% in the past 24 hours, currently trading around $2,600, indicating a bearish trend.
- Investors in major Ethereum ETFs are facing significant unrealized losses, averaging around 21%, as current prices are well below their cost basis.
- Technical indicators suggest further downside risks for Ethereum, with critical support at $2,600 and potential declines towards $2,400-$2,500 if this level fails.
- Despite the bearish outlook, a strong defense of support levels could lead to a recovery towards the $3,000 mark.
Having dropped over 3% in the past 24 hours, Ethereum ETH/USD is showing a clear correction and trading around $2,600. Technical indicators and institutional investment data show a worrisome picture for near-term price movement, so the second-largest cryptocurrency in the world is under increasing pressure.
Ethereum ETF Investors Drowning in Red: Average 21% Loss Revealed
Based on the most recent findings of crypto analytics company Glassnode, investors in big spot Ethereum ETFs are suffering large unrealized losses. Now “substantially underwater,” the average investor in BlackRock and Fidelity’s Ethereum ETFs holds almost 21% in unrealized losses.
The extent of investor suffering shown by the difference between ETF cost basis and present market values BlackRock’s spot Ether ETF has a cost basis of $3,300; Fidelity’s sits even higher at $3,500—both well above ETH’s current trading range around $2,600.
Particularly in August 2024 when spot prices fell below typical ETF investor cost-basis levels and once more in January and March 2025, this underwater posture has set off rapid net withdrawals. Recent data, however, indicates nine straight days of inflows of $435.6 million since May 16, implying some stability as trade war concerns fade.
ETH/USD Technical Analysis Points to Further Downside Risk
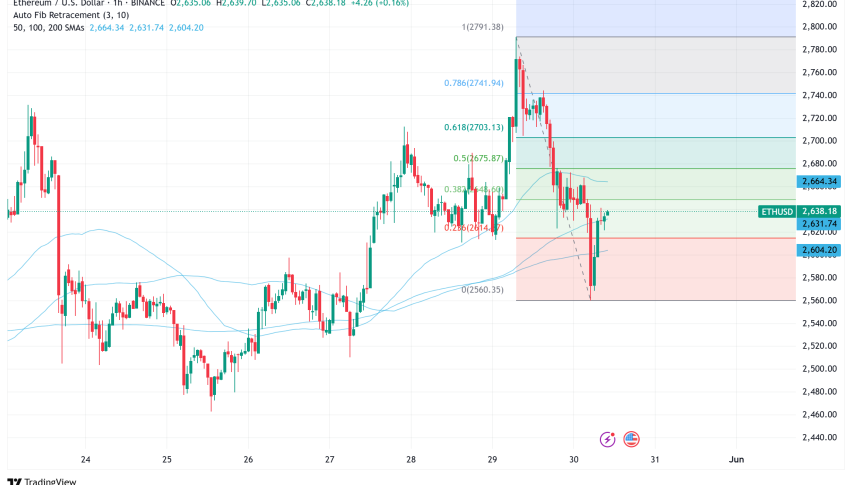
Given price behavior indicating ongoing bearish momentum, Ethereum’s technical picture still presents challenges. From the $2,780 resistance zone, ETH lately began a fresh fall below numerous important technical levels that had hitherto given support.
Ethereum has also broken a vital positive trend line that had been supporting trade below the $2,650 mark and the 100-hour Simple Moving Average. This breakdown marks a major change in the structure of the market since bears now control short-term price movement.
The latest rising movement from $2,493 to $2,787 has clearly breached the 50% Fibonacci retracing line, suggesting additional room for the pullback. Technical indicators are verifying this negative inclination; the RSI falls below the important 50 mark and the hourly MACD picks momentum in the bearish zone.
Critical Support and Resistance Levels Define Trading Range
Looking ahead, Ethereum encounters immediate opposition at the $2,625 level and more significant obstacles around $2,650 and $2,720. With further upside targets at $2,880 and $2,950, a clear move over $2,720 might perhaps set off a recovery towards the $2,780 resistance zone.
Still, failing to recover the $2,650 resistance lets further negative consequences flow. Though the most important level to monitor is $2,550, which corresponds with the 76.4% Fibonacci retracing level, initial support is at $2,600. This zone shows vital support that, should it be disrupted, would cause a more thorough correction toward either $2,500 or even $2,440.
The 200-day Exponential Moving Average at $2,455 is a vital make-or-break milestone on the daily basis. Consistent with the 50-day EMA, a daily closure below this crucial moving average can stretch the fall to the next significant support at $2,277.
Market Momentum Indicators Flash Warning Signs
The daily RSI reading of 64 clearly rejects overbought levels around 70; the indicator now points down and indicates waning positive momentum. This technical difference implies, at least in the near run, that the recent surge might have run out of steam.
Complementing the gloomy picture, the MACD indicator points to a bearish crossing, therefore indicating the lack of momentum and implying a possible continuous down trend. These momentum indicators produce a convergence of bearish signals compatible with the price action break-through.
Ethereum Price Prediction: Cautious Optimism with Downside Risks
Based on current technical and fundamental study, Ethereum is positioned for continuous volatility with a minor negative bias in the near future. The range of $2,550-$2,600 shows crucial support that will most likely lead the next major directional change.
Should this support zone fail, ETH might show a more noticeable retreat around $2,400-$2,500, therefore offering more attractive starting points for long-term investors. Conversely, a strong defense of existing support levels in tandem with a break above $2,720 resistance might motivate higher momentum into the psychologically important $3,000 level.
- Check out our free forex signals
- Follow the top economic events on FX Leaders economic calendar
- Trade better, discover more Forex Trading Strategies
- Open a FREE Trading Account
- Read our latest reviews on: Avatrade, Exness, HFM and XM
Related Articles

Sidebar rates
Related Posts
