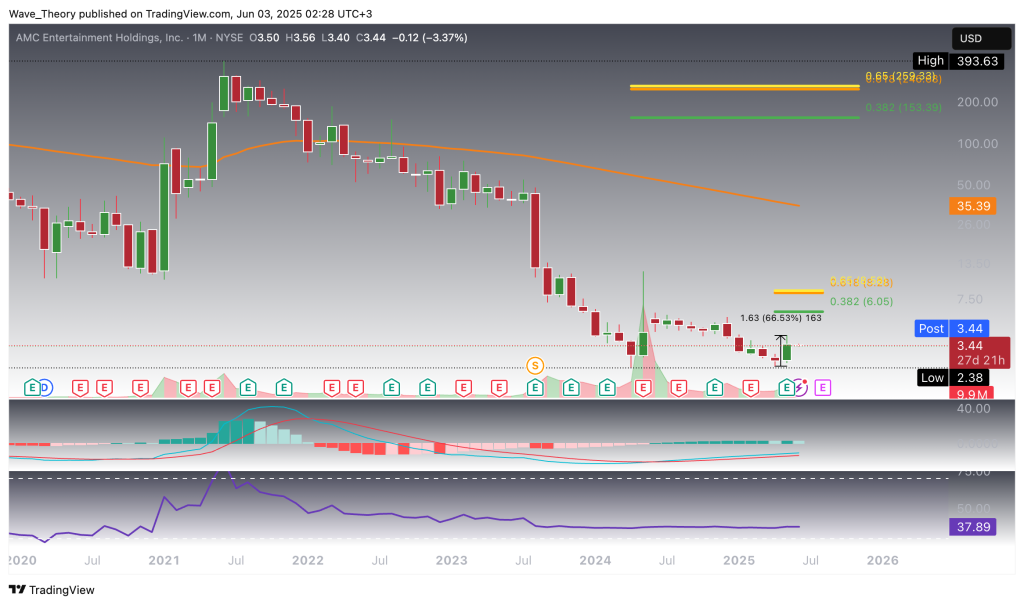
AMC stock has surged over 66.5% in the past month, reaching $4.08 from a low of $2.45.
Despite recent bullish momentum, mixed signals on daily and 4-hour charts indicate caution with potential bearish trends.
Key resistance levels at $3.64 and $4.40 could determine the stock's ability to maintain its upward trajectory.
A confirmed golden crossover in the 4-hour chart may signal a bullish shift if it overcomes near-term bearish momentum.
AMC stock has surged over 66.5% in the past month, reigniting bullish sentiment among retail traders and speculators. The key question now: can this momentum break the long-term downtrend, or is a reversal on the horizon?
AMC Stock Surges from $2.45 to $4.08 – Momentum Faces Initial Test
After establishing a temporary low at $2.45 in April, AMC has staged a strong recovery, rallying 66.5% over the past month to reach $4.08. This upward move was accompanied by a bullish shift in momentum, as reflected by the MACD histogram turning positive in May. However, more recently, the histogram has begun to tick lower, suggesting that bullish momentum may be fading.
Despite this early bearish signs, the MACD lines remain in a bullish crossover, supporting the medium-term trend structure. Meanwhile, the RSI continues to hover in neutral territory, offering no immediate directional bias. With mixed signals emerging, price action in the coming sessions will be critical in determining whether AMC can sustain its upward trajectory or revert toward its broader downtrend.
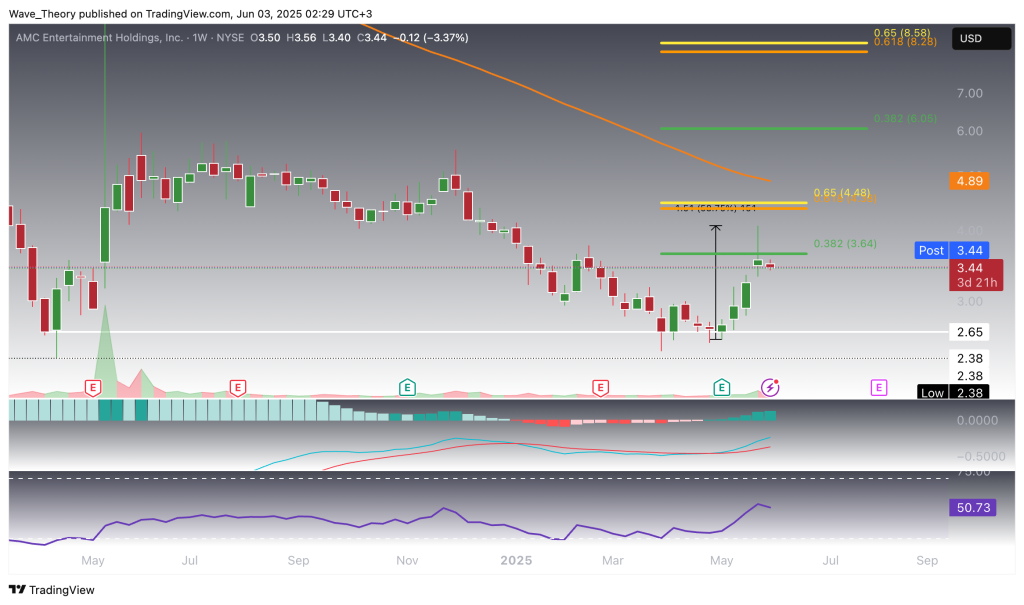
On the weekly chart, AMC continues to show signs of strengthening momentum. The MACD lines remain in a bullish crossover, and the MACD histogram is trending higher—both indicating a supportive mid-term outlook. The RSI, however, remains in neutral territory, suggesting that the stock is not yet overextended.
AMC now approaches key Fibonacci resistance levels at $3.64 and $4.40, which could pose significant short-term hurdles. A confirmed breakout above these levels would likely open the door for a continuation toward the 50-week EMA at $4.89, with extended upside targets at the next major Fibonacci levels of $6.05 and $8.50.
The coming weeks will be pivotal in determining whether AMC can overcome these technical barriers and shift decisively into a broader bullish trend.
AMC
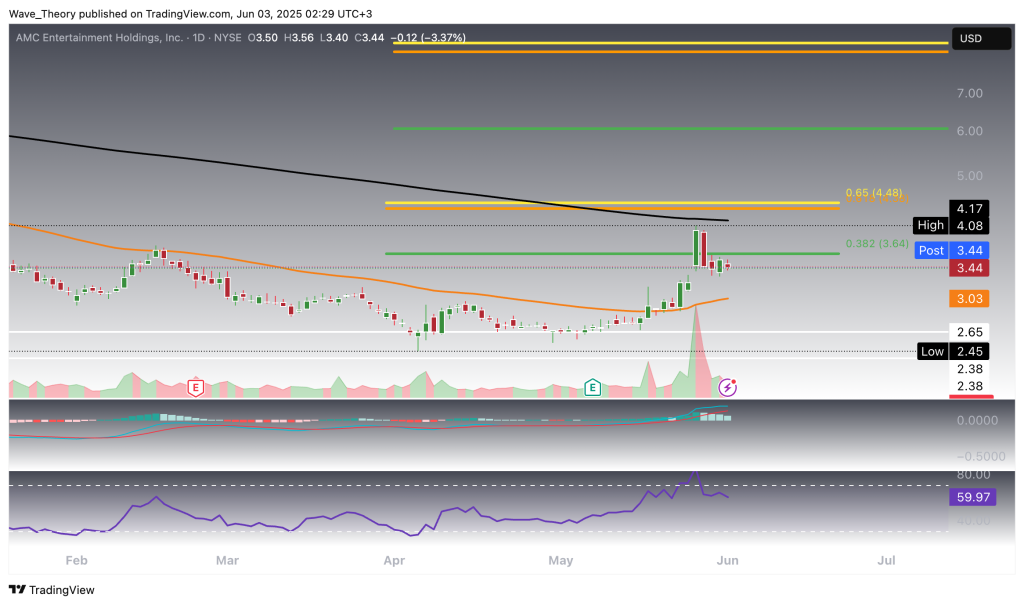
Daily Indicators Give Cautious Signals for AMC
On the daily chart, caution is warranted despite recent bullish price action. The exponential moving averages continue to display a death cross formation, reinforcing a bearish bias in the short- to medium-term trend structure. Additionally, the MACD histogram has been ticking lower, indicating fading momentum, even as the MACD lines remain in a bullish crossover—a sign of underlying indecision.
Meanwhile, the RSI remains in neutral territory, offering no strong directional cues at present. This mixed technical setup suggests that while recent gains have been notable, the broader trend remains vulnerable unless buyers can reassert control and overcome key resistance levels.
AMC
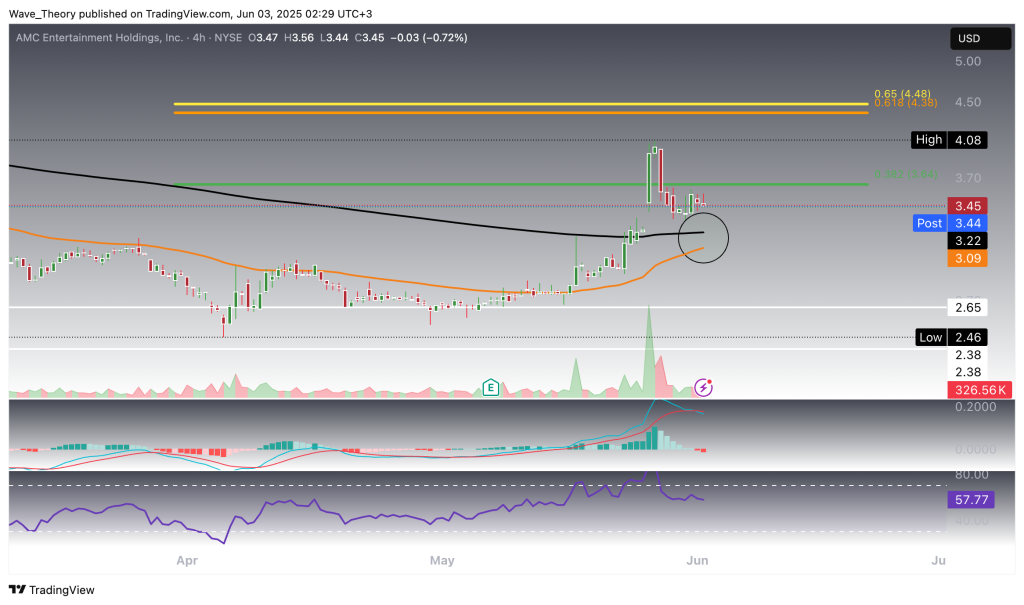
AMC 4H Chart: Golden Crossover on the Horizon
On the 4-hour chart, AMC presents a technically mixed setup. The MACD lines have just crossed bearishly, and the MACD histogram has begun to tick lower, indicating short-term weakness in momentum. At the same time, the RSI remains in neutral territory, reflecting a lack of strong directional conviction.
Notably, the exponential moving averages are on the verge of forming a golden crossover, which would signal a potential bullish shift in the short-term trend if confirmed. Traders should monitor the EMA alignment closely, as a successful crossover could override near-term bearish momentum and lay the groundwork for renewed upside pressure.
AMC
Summary
AMC shows mixed signals across timeframes: while the weekly chart reflects strengthening bullish momentum and the potential for a breakout above key resistance levels, the daily and 4H charts reveal cautionary signs with bearish MACD movements and unresolved EMA structures. A confirmed golden crossover or decisive break above $4.40 could shift momentum firmly in the bulls’ favor.
Konstantin Kaiser comes from a data science background and has significant experience in quantitative trading. His interest in technology took a notable turn in 2013 when he discovered Bitcoin and was instantly intrigued by the potential of this disruptive technology.