GameStop (GME) Faces Rejection At Key Resistance

Quick overview
- GameStop (GME) surged over 29% recently but faced resistance at the 0.382 Fibonacci level around $36.20, leading to a correction phase.
- Despite a strong upward move and bullish indicators, the broader trend remains bearish unless GME breaks above the key resistance at $48.
- GME has experienced a significant pullback of approximately 28% after failing to maintain support at the Fibonacci level, with potential further declines toward $26.50.
- Current momentum indicators show signs of weakening bullish momentum, suggesting that GME may face additional downside pressure unless buying pressure resumes.
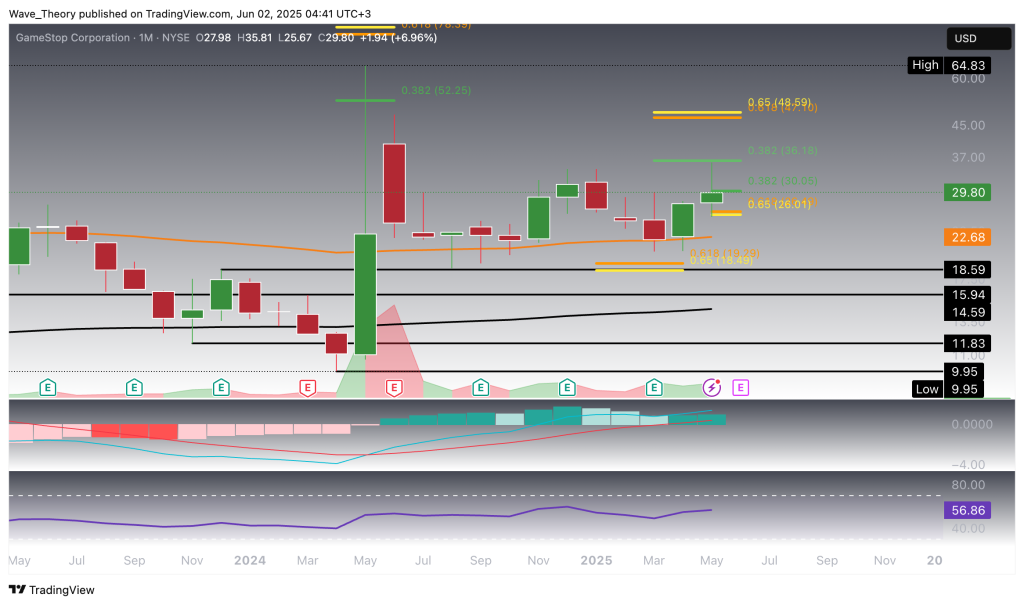
GameStop (GME) surged over 29% in the past two weeks, reaching a key Fibonacci resistance level around $36.20. However, the rally stalled at this critical point, triggering a correction phase as selling pressure emerged.
GameStop (GME) Stock Reaches Critical Fibonacci Resistance
Over the past two months, GameStop (GME) has managed to establish firm support above the 50-month EMA at $22.70, igniting a strong upward move toward the 0.382 Fibonacci retracement level at approximately $36.20. This rally has been accompanied by a bullish uptick in the MACD histogram, which began turning higher last month, while the MACD lines have formed a bullish crossover — signaling positive momentum.
At the same time, the RSI remains in neutral territory, offering neither overbought nor oversold signals, and suggesting room for directional movement. However, despite recent strength, the broader trend remains bearish unless GME decisively breaks above the key golden ratio resistance at $48. Without a breakout above this level, the current correction phase remains intact.
It’s worth noting that as the market has not yet opened, the current month of June is not yet reflected in the monthly technical indicators.
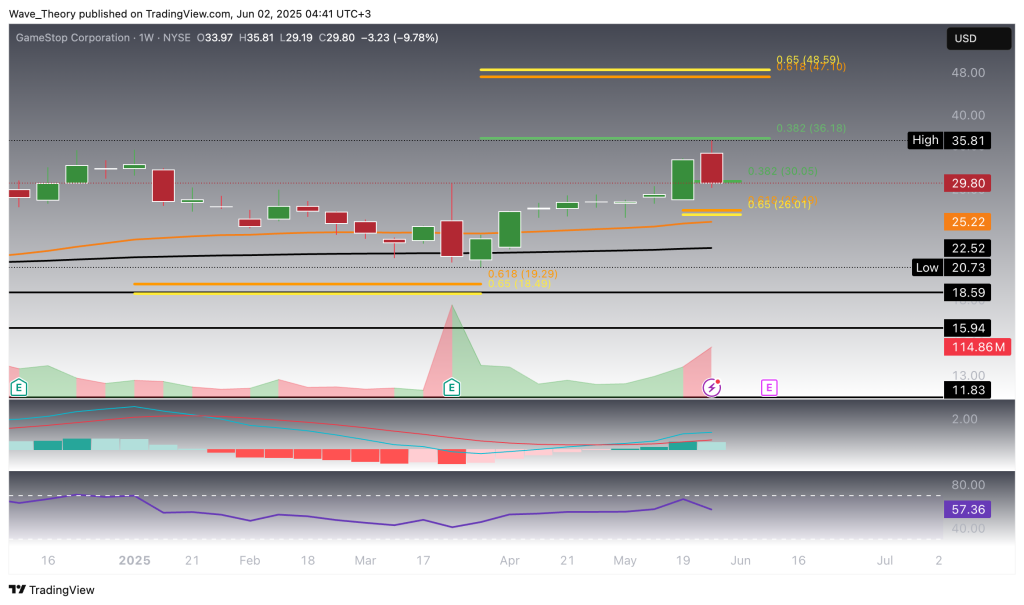
GameStop (GME) Stock Pulls Back 28% After Key Resistance Rejection
After testing the 0.382 Fibonacci retracement level at $36.20, GameStop (GME) faced clear resistance and has since entered a corrective phase, pulling back by approximately 28%. Despite the short-term weakness, the technical structure remains constructive: both the MACD lines and the exponential moving averages (EMAs) are still bullishly crossed, indicating a supportive medium-term trend.
However, early signs of momentum loss are emerging. The MACD histogram has begun to tick lower, suggesting weakening bullish momentum, while the RSI continues to hover in neutral territory, offering no immediate directional bias. GME remains technically vulnerable unless renewed buying pressure emerges above key resistance levels.
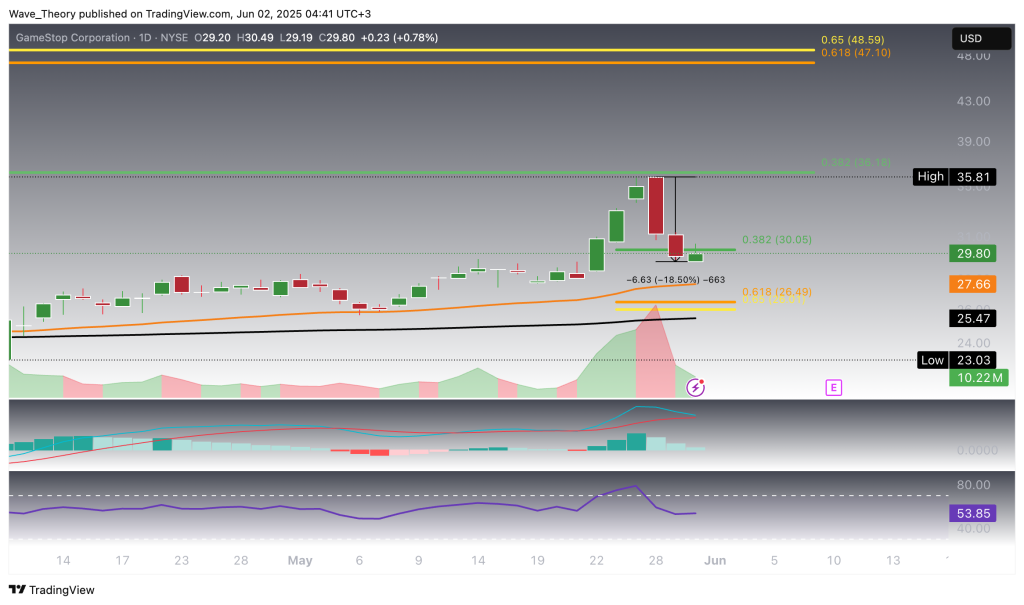
Will GameStop (GME) Stock Retrace Down to $26?
GameStop (GME) has seen a sharp 18.5% decline within just two trading days, breaking below the 0.382 Fibonacci support at $30 — a key level that had previously provided footing. This bearish break opens the path for a potential continuation of the correction toward the next major support at the Golden Ratio Fibonacci level, around $26.50.
Momentum indicators are beginning to align with this downside risk: the MACD histogram has been ticking lower for three consecutive sessions, and the MACD lines are on the verge of a bearish crossover — signaling waning bullish momentum. Meanwhile, the RSI remains directionless in neutral territory, providing no immediate edge for either bulls or bears.
Despite the pullback, the EMAs remain in a golden crossover configuration, which still confirms a bullish bias in the short- to medium-term trend. This creates a mixed technical setup — where momentum suggests further downside, but trend structure hasn’t yet broken down.
Price action near the $26.50 level will be critical in determining whether this is a deeper retracement or merely a healthy correction within an evolving uptrend.
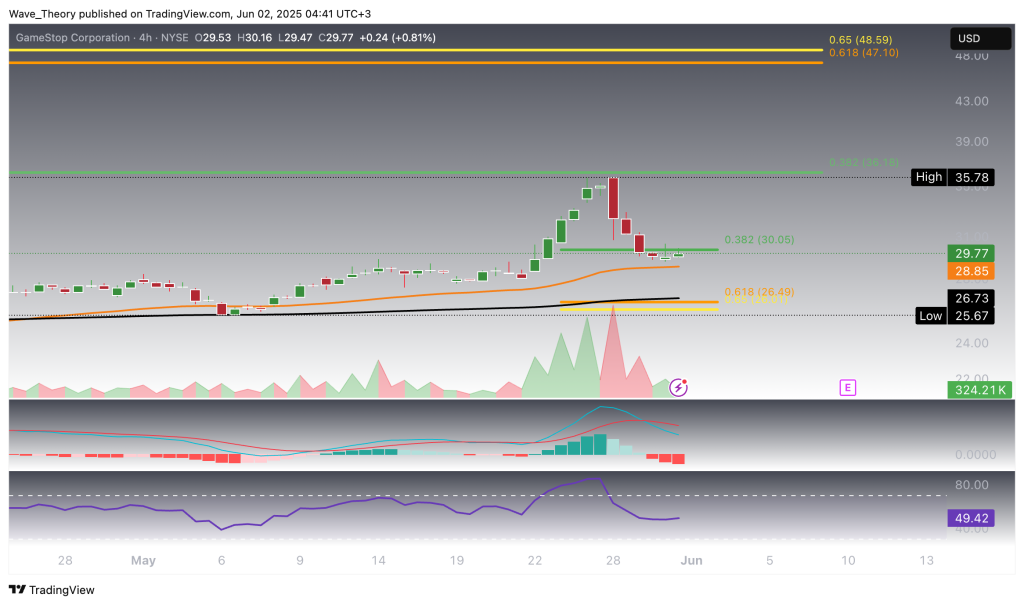
GameStop (GME) Holds Above 50-4H EMA, But Momentum Weakens
GameStop (GME) continues to hold above the 50-period EMA on the 4-hour chart at $28.85 — a constructive sign for the short-term trend. Additionally, the EMA structure remains in a golden crossover, reinforcing a bullish bias in the near term.
However, momentum indicators are starting to diverge from this trend. The MACD lines have crossed bearishly, and the MACD histogram has been ticking lower recently, indicating growing bearish momentum. Meanwhile, the RSI remains in neutral territory, offering no strong directional cues.
This mixed technical setup suggests that while GME retains short-term trend support, further downside pressure cannot be ruled out unless bullish momentum resumes.
- Check out our free forex signals
- Follow the top economic events on FX Leaders economic calendar
- Trade better, discover more Forex Trading Strategies
- Open a FREE Trading Account
- Read our latest reviews on: Avatrade, Exness, HFM and XM