Newegg Stock Explodes 68%, Breaks Above $10 – Can the Rally Hold?
Newegg Commerce stock staged an explosive rally today, driven by speculative momentum rather than news, marking a major technical breakout..
Quick overview
- Newegg Commerce stock surged 68% during Thursday's trading session, closing at $10.53, marking a significant technical breakout.
- The rally was driven by speculative momentum, with no official news or announcements to justify the surge, resulting in trading volume exceeding 1,000% of the normal average.
- Despite the impressive gains, market participants remain cautious, recalling previous instances of sharp sell-offs following similar surges.
- Newegg's FY2024 results showed declines in net sales and active customers, indicating challenges in demand and customer retention, although cost controls improved net loss and adjusted EBITDA.
Newegg Commerce stock staged an explosive rally today, driven by speculative momentum rather than news, marking a major technical breakout above key levels.
Newegg Commerce Soars as Buyers Storm In
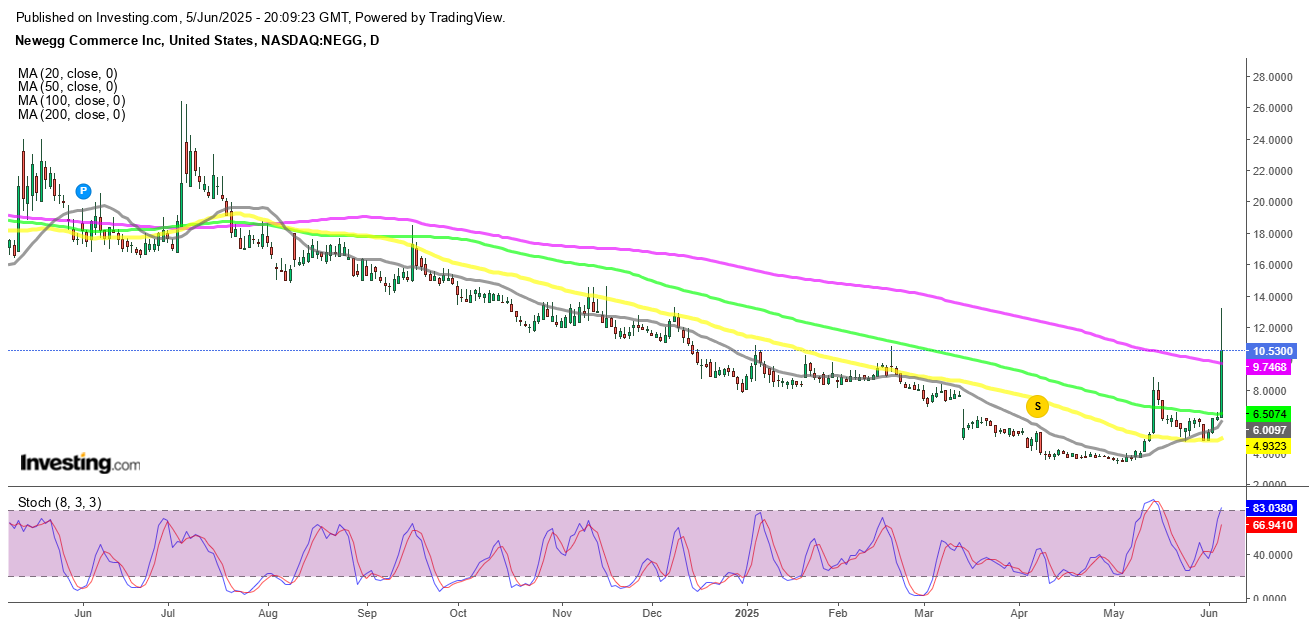
Shares of Newegg Commerce (NASDAQ: NEGG) skyrocketed 68% during Thursday’s U.S. trading session, closing at $10.53 — a gain of $4.25 from the previous day’s close of $6.28. The stock reached an intraday high of $13.18, marking its most bullish performance since February and rekindling interest in the e-commerce retailer’s turnaround potential.
Technical Breakout: First Move Above $10 Since February
With today’s rally, NEGG not only broke above the psychologically important $10 level, but also surged past the 200-day simple moving average (SMA) — a widely watched technical indicator used by traders to assess long-term momentum. While this breakout may hint at a trend reversal, it will require continued buying pressure in the next few sessions to confirm the shift. The stock has previously seen short-lived surges, followed by sharp declines.
No News, No Problem? Volume Surges Over 1,000%
What made the rally particularly notable is that Newegg released no official news to justify the surge. There were no fresh SEC filings, earnings announcements, or business updates, suggesting the move was purely speculative in nature. Traders appear to have piled into the stock as part of a momentum-driven trade, pushing daily trading volume to over 10 times the normal average, signaling a surge in retail and algorithmic interest.
NEGG Stock Chart Daily – Trend Reversal or A Fakeout?
Reverse Stock Split Reignited Compliance in April
Back in April 2025, Newegg carried out a 20-for-1 reverse stock split, which lifted the per-share price enough to bring the company back into compliance with Nasdaq’s minimum bid price rules. This action proved successful: Newegg officially met compliance by April 22, stabilizing its status as a Nasdaq-listed company. Though the stock saw modest gains after the split, it had largely remained under the radar — until today’s explosive move.
Speculators Eye Bullish Continuation, But Caution Needed
Despite the strength of today’s rally, market participants are treating the surge with a degree of skepticism. Similar rallies have occurred for NEGG in the past, only to be followed by sharp sell-offs. Whether this move signals renewed investor confidence or simply short-term momentum chasing remains to be seen.
2024 Fiscal Year Summary – Newegg
Financial Highlights
- Net Sales: Fell to $1.24 billion in FY2024, down from $1.50 billion in FY2023.
- Gross Merchandise Value (GMV): Declined to $1.53 billion, versus $1.81 billion last year.
- Gross Profit: Decreased to $131.5 million, from $167.6 million a year earlier.
- Net Loss: Narrowed to $43.3 million, an improvement from $59.0 million in FY2023.
- Adjusted EBITDA: Improved to ($9.5 million) from ($21.3 million) last year.
Operational Metrics
- Average Order Value: Increased to $396 (vs. $379 in FY2023).
- Active Customers: Dropped to 2.1 million, down from 2.5 million in the previous year.
- Repeat Purchase Rate: Declined to 26.0%, compared to 29.2% last year.
Conclusion: Newegg’s FY2024 results reflect a year of contraction in both sales and customer engagement. Revenue and gross profit both declined, mirroring weaker demand or possible competitive pressure, while the company continued to operate at a loss.
However, cost controls helped narrow both net loss and adjusted EBITDA. On the operational side, higher average order values suggest a shift toward more premium or larger-ticket purchases, though the overall customer base and repeat buying activity weakened. The financial and operational trends point to a business in transition, focused on profitability improvements despite headwinds in customer retention and volume.
- Check out our free forex signals
- Follow the top economic events on FX Leaders economic calendar
- Trade better, discover more Forex Trading Strategies
- Open a FREE Trading Account
- Read our latest reviews on: Avatrade, Exness, HFM and XM
Related Articles
Sidebar rates
Related Posts
