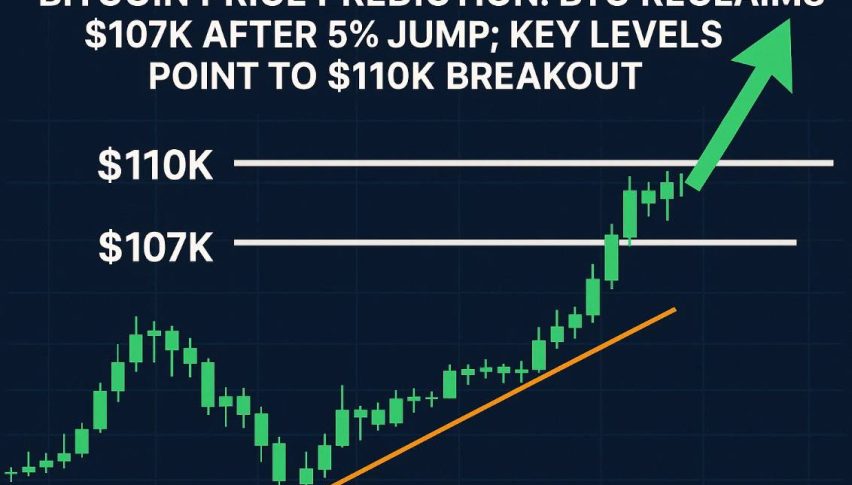
Bitcoin Price Prediction: BTC Reclaims $107K After 5% Jump; Key Levels Point to $110K Breakout
Bitcoin climbs above $107K after trendline breakout and Fed signals. Will bulls target $110K next? Key levels and market drivers explained.
Quick overview
Bitcoin is up 5% in the last 24 hours, back to $106,652 and flirting with $107,000. This comes after a dip below $100K and is driven by easing geopolitical tensions, rising rate cut odds and institutional inflows.
The market followed suit, with total market cap up 4.4% to $3.26 trillion and trading volumes 10% to $150 billion. Ethereum is up 7% and risk sentiment improved globally after a 12-day conflict in the Middle East ended.
Investor confidence was also boosted by a pullback in oil prices and dovish comments from the Fed. Governor Michelle Bowman and Christopher Waller both hinted at a July rate cut. As a result, the CME FedWatch Tool now shows a 23% chance of a 25-basis-point cut – up from 16% last week.
Fed Signals and Regulation Support BTC
Bitcoin’s price is also supported by regulatory clarity. The US Federal Reserve said it will no longer factor in “reputational risk” when assessing banks’ involvement with crypto companies. This could mean smoother banking access for digital asset businesses.
Meanwhile, institutional interest is still strong:
-
US listed Bitcoin ETFs have seen 10 days of net inflows.
-
Corporations hold over 3.2% of all circulating BTC.
-
Bitcoin as a treasury reserve is gaining traction.
These factors, combined with dovish monetary signals, have kept buyers engaged despite earlier stress.
Technical Outlook: Can Bitcoin Break $110K?
On the 2-hour chart, BTC/USD has broken out above the descending trendline that capped price action since mid-June. The move was backed by a bullish crossover of the 50-EMA ($104,317) and 200-EMA ($104,818). Price is consolidating at $107,000 – a key horizontal resistance.
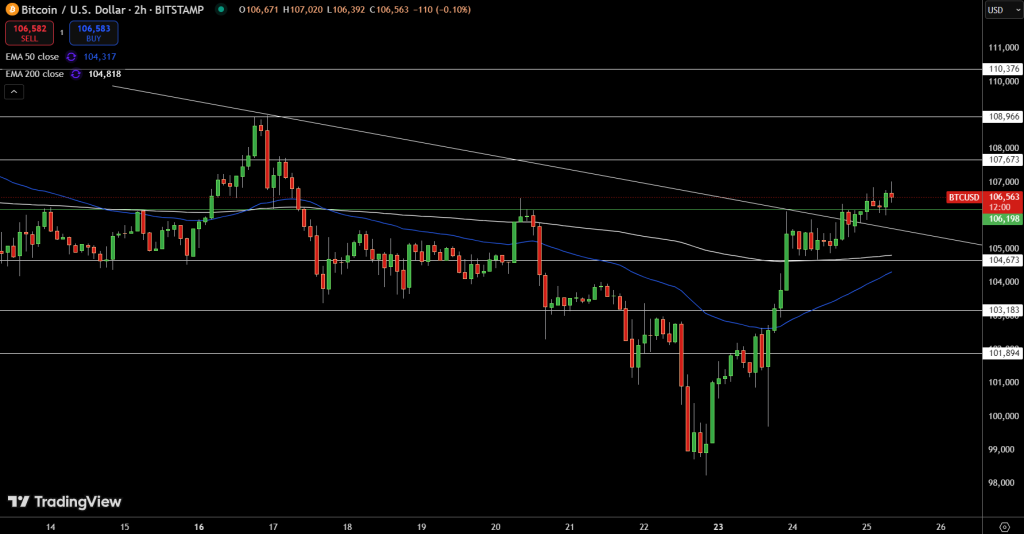
Short term momentum is bullish after BTC retested the 200-EMA and held above $106,200. A close above $107,673 could see price move to $108,966 and $110,376.
Levels to Watch:
-
Bullish breakout entry: Close above $107,700
-
Upside targets: $108,966 and $110,376
-
Support: $106,200 and $105,600
-
Risk: Below $100,000, $96,000
Macro risks still present but technical and fundamentals are bullish. Wait for a close above $107.7K before going long.
- Check out our free forex signals
- Follow the top economic events on FX Leaders economic calendar
- Trade better, discover more Forex Trading Strategies
- Open a FREE Trading Account
- Read our latest reviews on: Avatrade, Exness, HFM and XM
Related Articles

Sidebar rates
Related Posts
