Nektar Therapeutics (NKTR) Stock Revival: Is This the Start of a Major Comeback?

Quick overview
- Nektar Therapeutics (NKTR) has experienced a remarkable 350% surge in just one week, raising questions about the sustainability of this rally.
- Despite the recent spike, NKTR has faced a long-term downtrend, losing 99.63% of its value since its 2018 high.
- Technical indicators show mixed signals, with a bullish MACD but an overbought RSI, suggesting caution for investors.
- The stock's upward trend is contingent on maintaining support above $18.50, as a drop below this level could lead to significant downside risk.
Nektar Therapeutics (NASDAQ: NKTR) has seen a stunning surge of nearly 350% in just one week, capturing the attention of investors and traders alike. But is this dramatic rally the beginning of a sustained comeback—or just a temporary spike?
Nektar Therapeutics (NKTR) Stock Is Highly Volatile
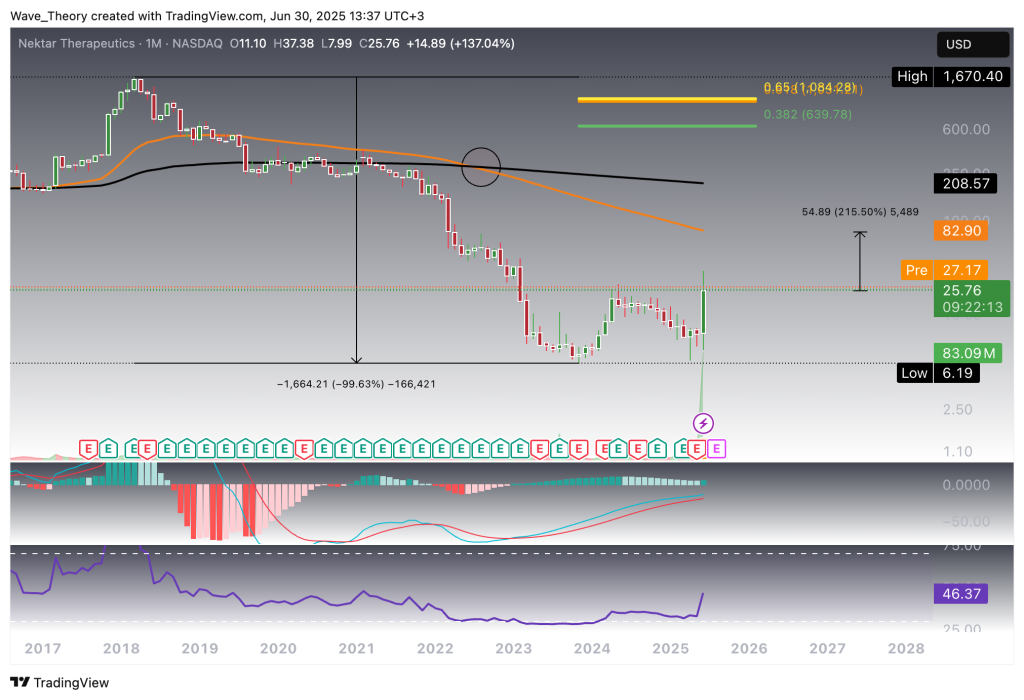
Nektar Therapeutics (NKTR) has been in a pronounced long-term downtrend, shedding an extraordinary 99.63% of its value since its 2018 high of $1,670.40, reaching a low at just $6.19. This multi-year decline has firmly established the stock as one of the most volatile names in the biotech sector.
In 2022, the long-term bearish bias was technically confirmed when the exponential moving averages (EMAs) formed a death cross, cementing the prevailing downward momentum. Despite this, NKTR showed brief bullish relief in early 2024, with a few months of sustained upward movement. However, that uptrend was entirely retraced within this year, reaffirming seller dominance.
Notably, June 2025 marks a technical inflection point. For the first time in over a year, the MACD histogram has turned bullish, indicating a potential shift in momentum. The MACD lines have remained in a bullish crossover configuration throughout, suggesting latent upside pressure building below the surface. Meanwhile, the Relative Strength Index (RSI) is holding in neutral territory, leaving significant room for a continued move higher without entering overbought conditions.
While the long-term trend remains decisively bearish, the current rally shows signs of strength. Upside potential extends approximately 215.5% from current levels before encountering major resistance at the 50-month EMA, a key long-term barrier that could determine whether this move evolves into a full trend reversal or another failed breakout attempt.
For now, the stock remains speculative, but technically compelling. Momentum traders and mean reversion strategies alike will be watching this level closely.
Nektar Therapeutics (NKTR) Stock Surges Nearly 350% in One Week: Breakout or Blowoff?
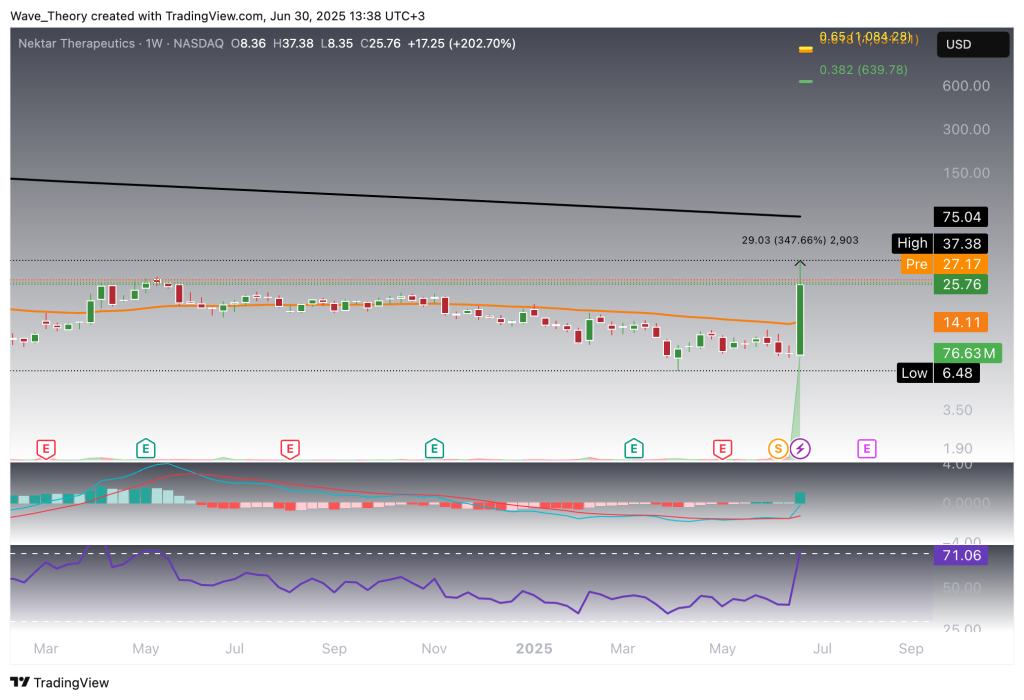
In an explosive move, Nektar Therapeutics (NKTR) has surged by nearly 350% over the past week, marking one of the most dramatic short-term rallies in the biotech space this year. This upward thrust has pushed NKTR decisively through the 50-week exponential moving average (EMA) at $14—a level that had previously acted as stiff resistance, capping price advances multiple times in the past.
From a technical standpoint, indicators are sending mixed signals:
-
MACD Histogram: Ticking bullishly higher, suggesting strengthening upside momentum.
-
MACD Lines: Still in a bullish crossover, reinforcing the momentum shift.
-
RSI: Now in overbought territory, which could imply short-term exhaustion or the potential for a pullback.
-
EMA Structure: Despite the breakout, the EMAs remain in a death cross formation, signaling that the medium-term trend remains bearish.
While the breakout above long-term resistance is technically significant, especially given the magnitude of the weekly move, the persistence of the death cross and overbought RSI conditions suggest caution. A sustained trend reversal would require follow-through above the 50-week EMA with volume and further structural confirmation.
Daily Chart: Golden Crossover on the Horizon Amid Building Volatility
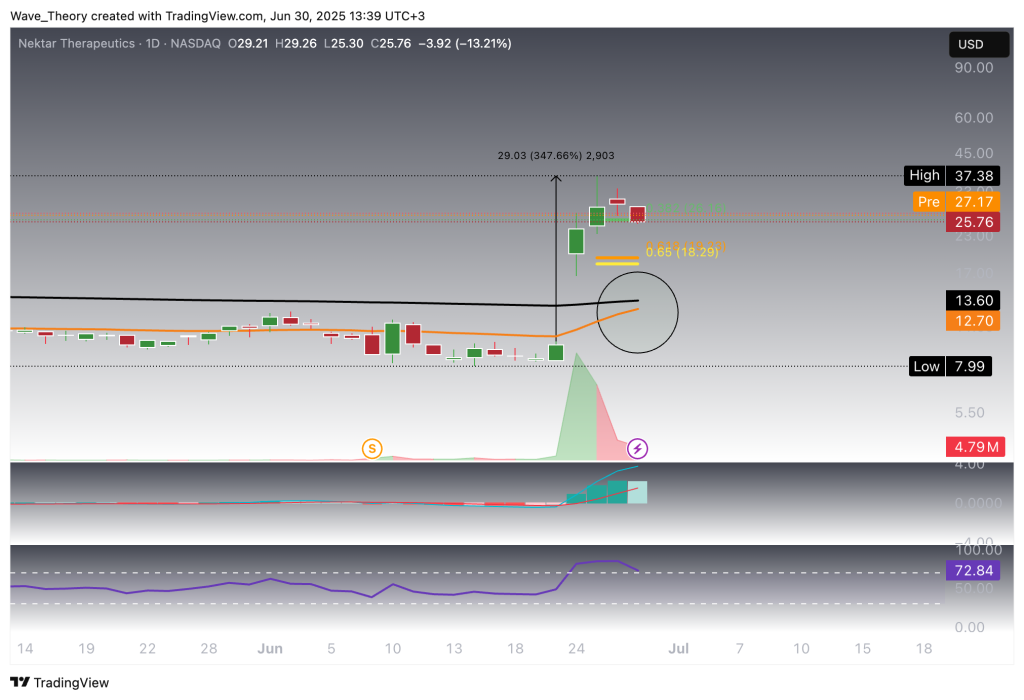
On the daily chart, Nektar Therapeutics (NKTR) is approaching a potential golden crossover, as the shorter-term EMA edges closer to crossing above the longer-term EMA. Should this materialize, it would provide a short- to medium-term bullish confirmation of the ongoing trend reversal.
Technically, the MACD lines remain in a bullish crossover, supporting the upside bias, while the RSI has cooled off from overbought levels and is now returning toward neutral territory—suggesting there is still room for continued movement in either direction.
However, bearish momentum may be starting to build. On Friday, the MACD histogram ticked lower, marking a potential shift in short-term momentum. Furthermore, Thursday’s price action initiated a corrective pullback, bringing NKTR down to the 0.382 Fibonacci retracement level at approximately $26, which is now acting as immediate support.
With the broader market reopening soon, increased volatility is likely. Should the $26 support fail to hold, the next key level lies at the golden ratio Fibonacci support, around $18.50—a level that could attract dip buyers if tested.
NKTR Stock Faces Potential 31% Downside Toward Key Fibonacci Support
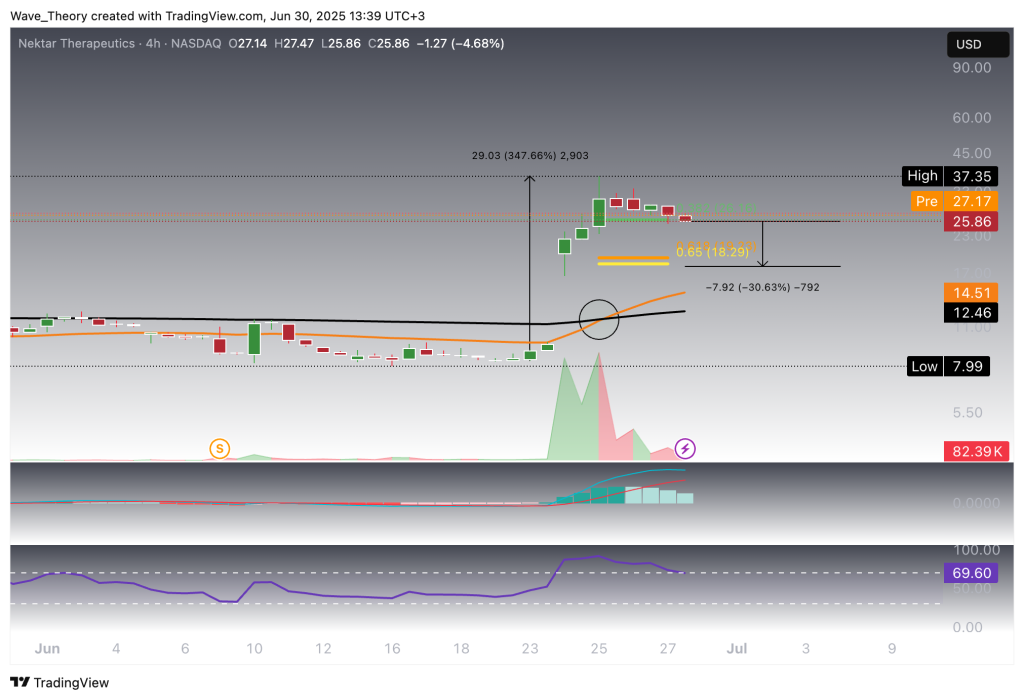
While Nektar Therapeutics (NKTR) remains in a newly established upward trend, the bullish structure holds only as long as price stays above the golden ratio support at $18.50. A breakdown below this level would mark a structural failure in the current rally and expose the stock to downside risk of approximately 31% from current levels.
On the 4-hour chart, momentum indicators present a mixed but cautious picture:
-
The MACD histogram has been ticking bearishly lower, signaling a possible weakening in short-term momentum.
-
MACD lines remain in a bullish crossover, keeping the broader uptrend technically intact for now.
-
The RSI has cooled back to neutral territory, leaving room for either a renewed push higher or a deeper retracement.
-
Importantly, the EMAs have recently formed a golden crossover, offering bullish confirmation in the short term.
Conclusion:
The trend remains bullish above $18.50, but traders should monitor this level closely. A decisive break below could invalidate the current structure and open the door to further downside pressure.
- Check out our free forex signals
- Follow the top economic events on FX Leaders economic calendar
- Trade better, discover more Forex Trading Strategies
- Open a FREE Trading Account
- Read our latest reviews on: Avatrade, Exness, HFM and XM
Related Articles
Sidebar rates
