BONK, WIF, FLOKI Rally—3 Breakout Targets You Need to Watch Now
Meme coins Bonk (BONK), Dogwifhat (WIF) and Floki (FLOKI) are on the move as Bitcoin’s all-time high above $116,800 brings back the crypto.
Quick overview
- Meme coins Bonk (BONK), Dogwifhat (WIF), and Floki (FLOKI) are gaining momentum as Bitcoin reaches a new all-time high.
- BONK has broken out of a bullish pattern, targeting $0.00002958 after a strong performance.
- WIF has reclaimed $1.00 and is testing resistance at the 200-day EMA, with potential targets of $1.212 and $1.679.
- FLOKI has also broken out of a downtrend, aiming for $0.0001148 after reclaiming the $0.0001000 level.
Meme coins Bonk (BONK), Dogwifhat (WIF) and Floki (FLOKI) are on the move as Bitcoin’s all-time high above $116,800 brings back the crypto party. With Bitcoin’s dominance below 65% investors are looking at high-risk altcoins. Meme coins – often driven by community hype – are quick to capitalize on the “risk-on” sentiment.
This renewed interest has sent BONK to a new 30-day high after a 12% up day on Thursday and 2% up day on Friday. WIF has reclaimed $1.00 and FLOKI has broken above the $0.0001000 level. Technicals are looking bullish across the board.
BONK Breaks Out of Bullish Pattern
BONK is looking strong after breaking out of an inverted head and shoulders pattern – a reversal signal. The neckline at $0.00002375 is a key level BONK needs to hold to target more upside.
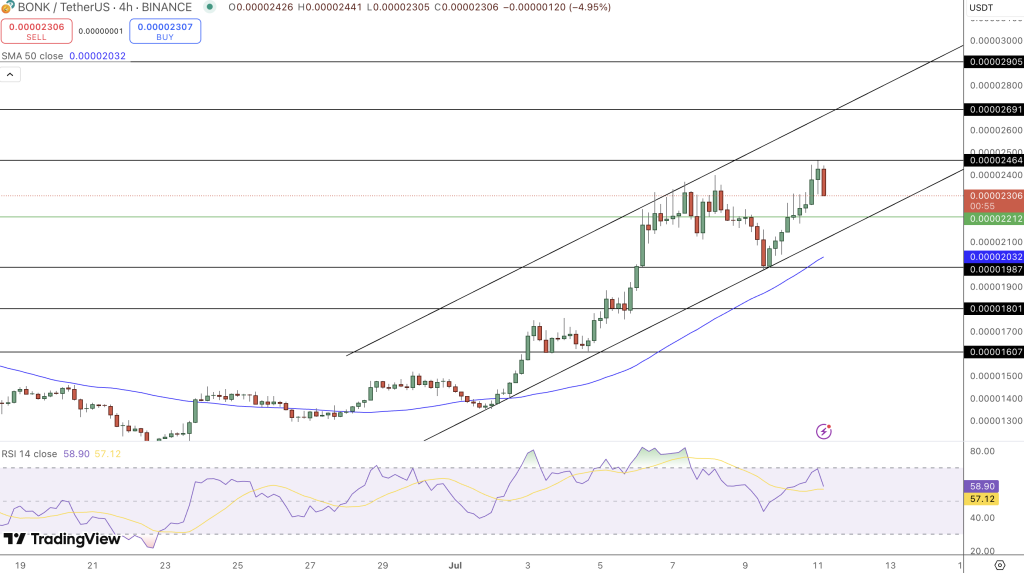
Key Technicals:
- Above 50% Fib at $0.00002350
- Targets:
- 61.8% Fib: $0.00002958
- 78.6% Fib: $0.00004105
- 50-day EMA above 100-day EMA (bullish crossover)
- RSI overbought; MACD up
If it corrects BONK will find support at the 200-day EMA at $0.00001871.
WIF and FLOKI Test Resistance
Dogwifhat (WIF) has broken above $1.00 and is testing the 200-day EMA at $1.066 after breaking out of a descending wedge. If WIF closes above this line it may go to:
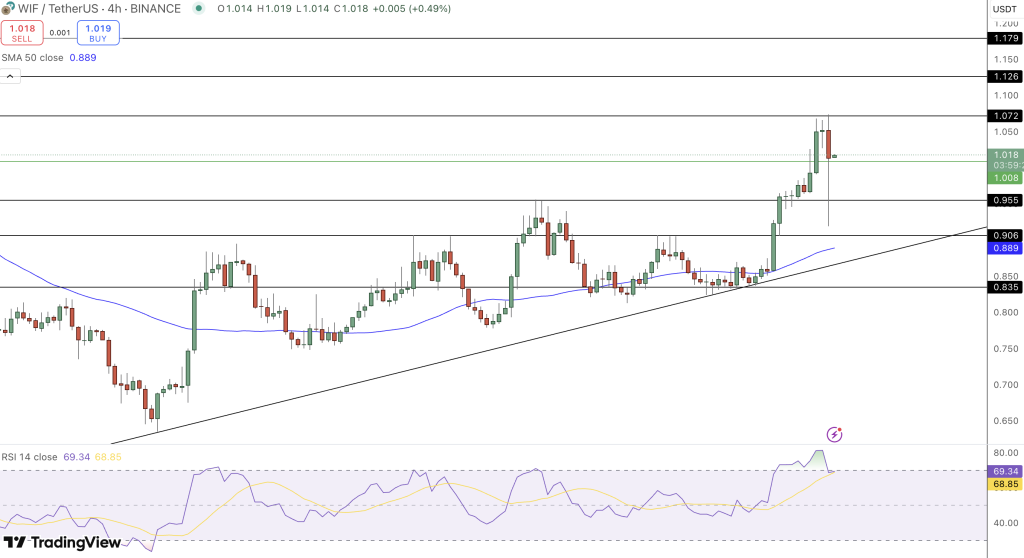
- 50% Fib: $1.212
- 61.8% Fib: $1.679
The MACD histogram is rising and the RSI is 63. More upside to come? But if it fails to clear the 200-day EMA it may retest the 100-day EMA at $0.860.Floki (FLOKI) has broken out of the downtrend and reclaimed the $0.0001000 level and the 200-day EMA. Now it’s looking at:
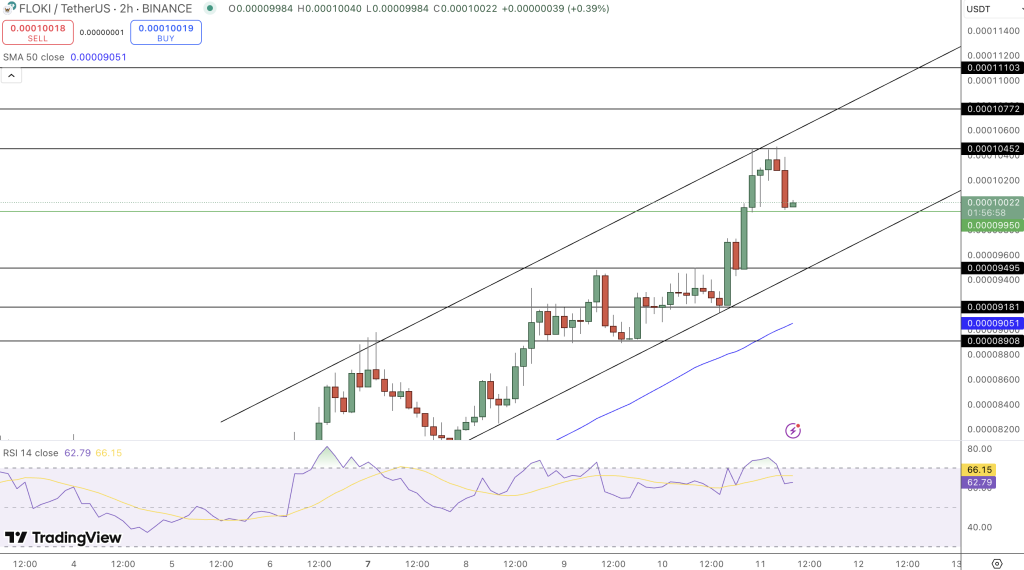
- 50% Fib: $0.0001148
- 61.8% Fib: $0.0001428
Momentum is strong with MACD above zero and RSI 68. A drop below the 200-day EMA will pull FLOKI back to the 100-day EMA at $0.0000848.
Takeaway:
- BONK to $0.00002958 after pattern breakout
- WIF to $1.212 and $1.679 if 200-day EMA is cleared
- FLOKI to $0.0001148 after channel breakout
As Bitcoin cools, meme coins are taking center stage – backed by technicals and market dynamics.
- Check out our free forex signals
- Follow the top economic events on FX Leaders economic calendar
- Trade better, discover more Forex Trading Strategies
- Open a FREE Trading Account
- Read our latest reviews on: Avatrade, Exness, HFM and XM
Related Articles


Sidebar rates
Related Posts
