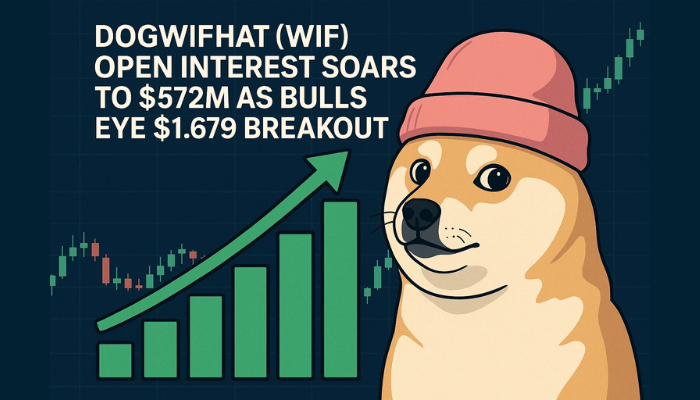
Dogwifhat (WIF) Open Interest Soars to $572M as Bulls Eye $1.679 Breakout
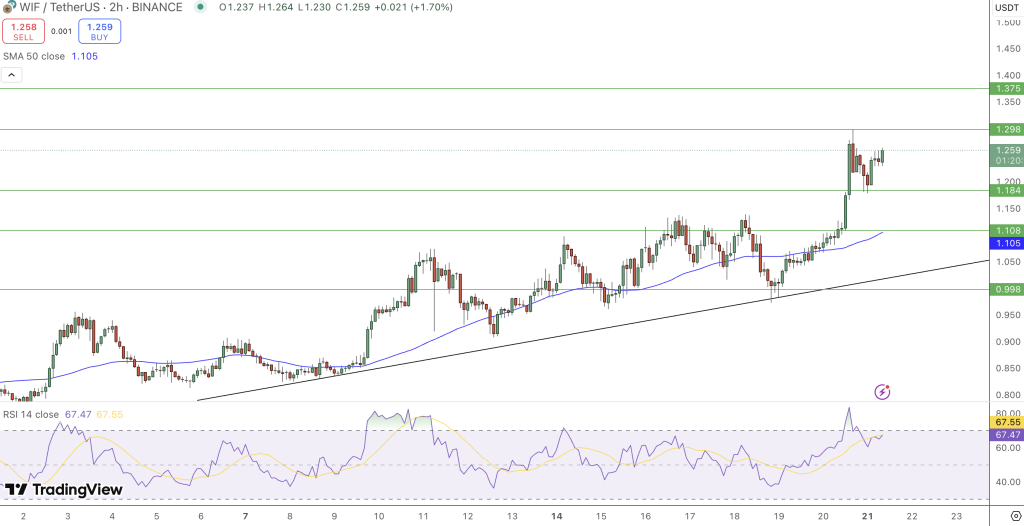
WIF (WIF), the Solana-based meme token, dipped 1% on Monday after a 12% gain on Sunday. Despite the pullback...
Quick overview
- WIF, the Solana-based meme token, experienced a 1% dip on Monday after a significant 12% gain on Sunday, but remains bullish above the $1 level.
- Market participants are eyeing the $1.212 level as a key resistance point, which could lead to the highest daily close since January 26 if surpassed.
- Open Interest for WIF surged to an all-time high of $572.11 million, indicating increased bullish sentiment among traders.
- Technical indicators suggest a strong short-term trend, with potential for a breakout to $1.679 if momentum continues.
WIF (WIF), the Solana-based meme token, dipped 1% on Monday after a 12% gain on Sunday. Despite the pullback, WIF is still bullish, having reclaimed the $1 level and broken above the 200-day Exponential Moving Average (EMA) at $1.066. Now, market participants are looking at the $1.212 level, which is the 50% Fibonacci retracement from the all-time high of $4.830 to the April low of $0.304.
If WIF closes above $1.212, that would be the highest daily close since January 26. Based on Fibonacci, the next resistance is at $1.679—the 61.8% retracement.
Open Interest Hits All Time High
Coinglass data shows Dogwifhat’s Open Interest (OI) surged to $572.11 million on Monday from $482.89 million on Sunday. That’s a $89 million increase in 24 hours.
A spike in OI like this usually means a rise in bullish sentiment, especially when backed by a positive funding rate. The OI-weighted funding rate for WIF is 0.0182%, which means traders are willing to pay premiums to hold longs—a sign of buying dominance.
Key Technical Indicators:
- 50-day EMA above 100-day EMA: Strong short-term trend
- MACD above zero line: Bullish momentum
- RSI 66: Approaching overbought, demand is growing
Golden Cross and Pullback Levels
If the 50-day EMA extends its lead over the 200-day EMA, that would be a Golden Cross—a bullish signal. That would attract new buyers, including sidelined investors waiting for a confirmation.
The MACD and green histogram are bullish, and the RSI is approaching overbought. But if bulls can’t clear $1.212, a pullback to the 200-day EMA at $1.066 is possible.
In summary, WIF has near term resistance, but its setup and investor interest suggests a breakout to $1.679 if momentum holds.
- Check out our free forex signals
- Follow the top economic events on FX Leaders economic calendar
- Trade better, discover more Forex Trading Strategies
- Open a FREE Trading Account
- Read our latest reviews on: Avatrade, Exness, HFM and XM
Related Articles


Sidebar rates
Related Posts
