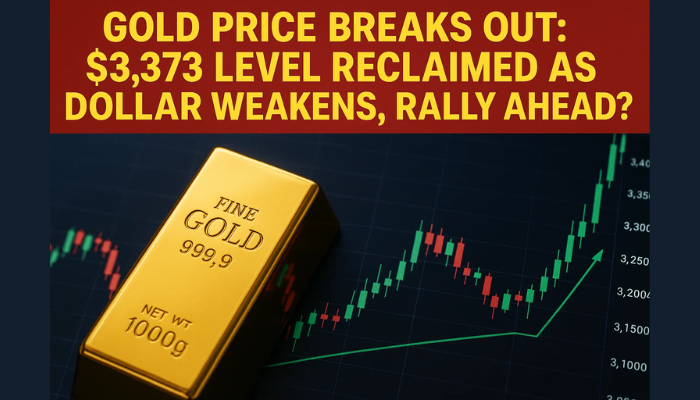
Gold Price Breaks Out: $3,373 Level Reclaimed as Dollar Weakens, Rally Ahead?
Gold up as dollar softens and trade hopes build. Spot price breaks above $3,373, out of symmetrical triangle.
Quick overview
- Gold prices are rising as the dollar weakens and trade tensions create safe-haven demand.
- Technical indicators show a bullish trend for gold, with key resistance levels at $3,394 and $3,411.
- Upcoming US trade negotiations and economic data are expected to influence gold's price movements.
- Short-term dips in gold prices may occur, but the overall outlook remains positive unless critical support levels are breached.
Gold up as dollar softens and trade hopes build. Spot price breaks above $3,373, out of symmetrical triangle.
The dollar is the key here. After weeks of strength, it’s finally faltering as traders get cautious on US tariffs on China and Europe. As Reuters reports, traders are getting defensive and gold is benefiting from the safe-haven trade. This is what happens when gold and the dollar move inversely – when the dollar goes down, gold goes up.
Geopolitical jitters and lack of clarity on US trade policy are adding to the gold narrative. With the Fed on hold and inflation data mixed, gold’s case is getting stronger – especially as traders rotate out of risk.
Gold Technicals Point Up
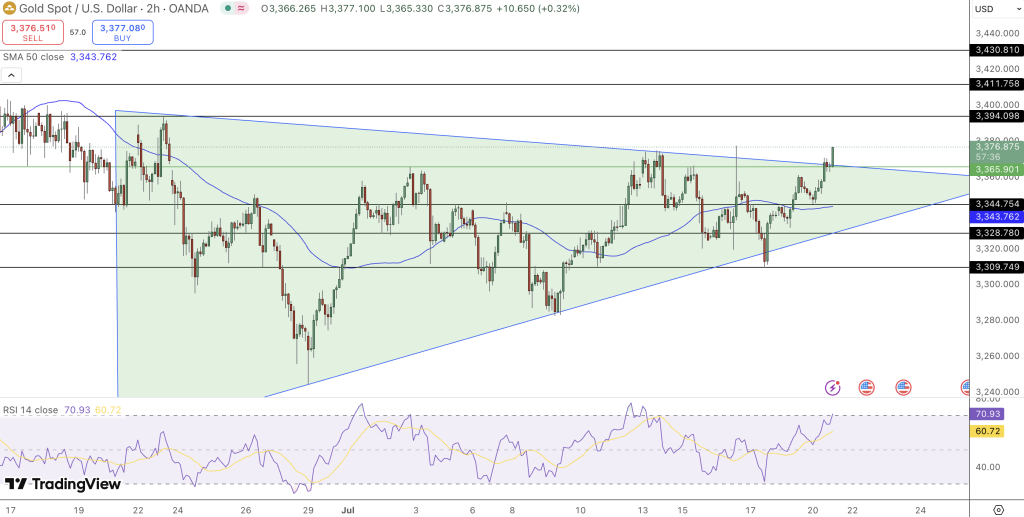
From a chart perspective, gold breaking above the triangle is a trend reversal. Gold reclaimed the 50 period SMA, now acting as support at $3,343. Price action has gone from choppy range trading to bullish structure, $3,394 and $3,411 are the next resistance levels.
RSI is at 69.45, close to overbought but still in bull territory. An RSI above 70 can be a cooldown but this type of overbought can precede a big rally if backed by volume.
If price fails to hold above $3,373, look for pullbacks to $3,328 or $3,309. But with the momentum we have, dips will be seen as buying opportunities rather than a reversal.
Key levels to watch:
- Resistance: $3,394 and $3,411
- Support: $3,343 (SMA), $3,328, $3,309
- RSI near 69: strong but not extreme
What to Expect This Week
Next week gold will be driven by macro. US trade negotiations, especially the August 1 tariff decision, will inject volatility into the market. A delay or escalation of tariffs will bring more safe-haven flows into gold and push price to $3,430 – a level not seen in weeks.
Watch out for upcoming economic data – durable goods orders and US GDP – which will impact the dollar and gold.
For now, gold’s technical breakout, a weakening dollar and geopolitical jitters set a bullish tone for the week. Short term dips will happen but the bigger picture remains constructive unless key support is broken.
- Check out our free forex signals
- Follow the top economic events on FX Leaders economic calendar
- Trade better, discover more Forex Trading Strategies
- Open a FREE Trading Account
- Read our latest reviews on: Avatrade, Exness, HFM and XM