JSE All-Share Index Retreats After Record High: Technical and Market Update
The JSE All-Share Index closed at 98,918.87 ZAR after briefly touching 100,000, as investors took a cautious approach...

Quick overview
- The JSE All-Share Index closed at 98,918.87 ZAR, experiencing a 1.05% pullback but remaining up 19% year-to-date.
- June inflation rose to 3.0%, supporting expectations for further rate cuts by the SARB, which has positively impacted the rand.
- South African equities are considered undervalued compared to US markets, with mining stocks up 73% year-to-date amid elevated gold prices.
- The JSE Top 40 is at a critical support zone, and its near-term direction will depend on gold prices and central bank policies.
The JSE All-Share Index closed at 98,918.87 ZAR after briefly touching 100,000, as investors took a cautious approach with mixed global and local economic signals. Despite the 1.05% pullback on Friday, the index is up 19% year-to-date, driven by mining, telecoms and tech. Naspers and surging gold prices were the drivers earlier in the week, but profit taking kicked in as investors weighed up the economic data.
Rand and Macro
June inflation was 3.0% year-on-year, up from 2.8% in May, but still within the SARB’s 3-6% target. This has cemented expectations for further rate cuts, which is supporting the rand and investor confidence. The SARB’s 25 basis point cut to 7.75% is to balance growth and price stability.
Market Sentiment and Drivers
Economists say SA equities are undervalued compared to US markets and some believe the official GDP numbers understate real economic activity. Gold prices are elevated at $3,334/oz and mining stocks are up 73% year-to-date. Major miners like Gold Fields and DRDGOLD are up 50-64% and mining is 12% of the JSE’s market cap. But analysts warn of ongoing volatility and operational risks in the sector.
Meanwhile the 2035 government bond yield dipped to 9.81% as local debt demand remains strong. Fiscal clarity will improve as the National Assembly passes the Appropriation Bill.
Technical: JSE Top 40
The JSE Top 40 is at a crossroads, trading just above the 91,200-91,400 support zone which is the 0.382 Fibonacci retracement and a rising trendline. The 50 period SMA at 90,749 is additional support. The RSI at 47 is neutral-weak.
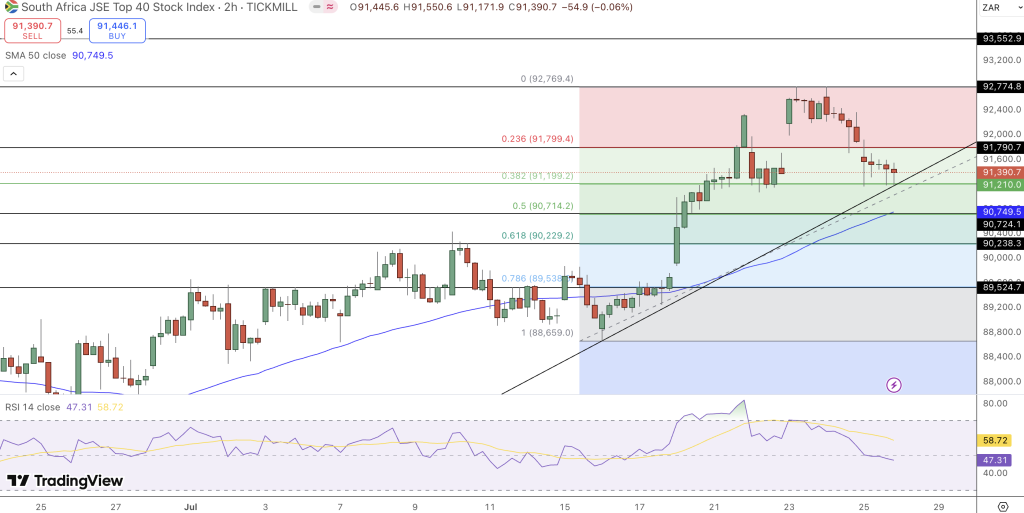
A bounce from here could see a move to 91,800 and 92,770. But a break below 91,200 could see further selling to 90,230. Watch for price action at these levels to determine the next move.
Key Takeaway:
The JSE’s near-term direction hinges on gold’s strength, central bank policy, and technical support on the Top 40. Investors should watch for a decisive move at the 91,200–91,400 zone for clues on market direction.
- Check out our free forex signals
- Follow the top economic events on FX Leaders economic calendar
- Trade better, discover more Forex Trading Strategies
- Open a FREE Trading Account
- Read our latest reviews on: Avatrade, Exness, HFM and XM
Related Articles


Sidebar rates
Related Posts
