Litecoin Poised for Major Breakout as Key Indicator Signals Potential Rally
Litecoin (LTC) is getting a lot of attention in the cryptocurrency market right now because important technical indicators show that the
Quick overview
- Litecoin (LTC) is gaining attention as it trades above $115, showing resilience in a volatile market.
- The recent crossover of the Average Directional Index (ADX) above 20 suggests a potential bullish trend similar to the 2017 rally.
- A long-term symmetrical triangle formation indicates possible price fluctuations, with resistance at $165 and support around $85.
- Analysts highlight the importance of maintaining support above $105 to sustain bullish momentum and avoid significant declines.
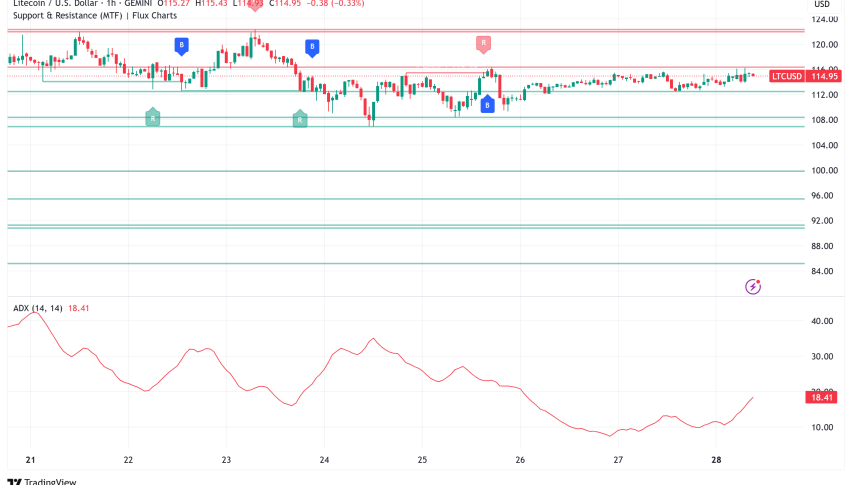
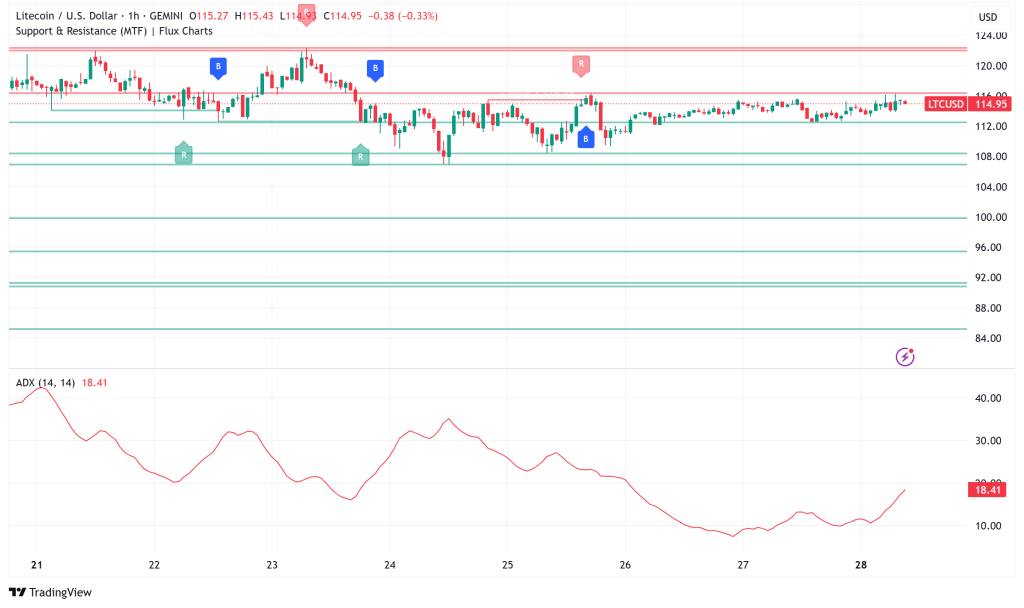
Litecoin LTC/USD is getting a lot of attention in the cryptocurrency market right now because important technical indicators show that the digital asset may be getting ready to make a big move up. LTC is a good choice for both short-term traders and long-term investors because it is trading above $115 and is holding up well even though the market is volatile.
Critical ADX Crossover Mirrors Historic 2017 Rally Pattern
Litecoin’s most important news is that its monthly Average Directional Index (ADX) recently crossed the important 20-level mark. Chartered Market Technician Tony Severino said that this technical milestone has a lot of historical importance because it is quite similar to the 2017 market cycle.
Litecoin saw an incredible rise from about $3 to $360 during the 2017 bull run. This was an amazing 11,900% rise after the ADX crossed the same 20-level line. The current setup reveals that the positive Directional Indicator (DI+) is finding support at the ADX line and starting to rise. This pattern is almost exactly like the one that happened during the last explosive cycle.
Analysts are keeping an eye on whether the ADX can consistently break through the 25 threshold, which would confirm the creation of a strong rising trend and could lead to purchasing pressure from both institutions and individuals.
Seven-Year Triangle Formation Approaches Decisive Breakout Zone
Litecoin’s price structure shows a strong long-term setup, even without the ADX signal. Since 2018, the cryptocurrency has been forming a huge symmetrical triangle, which technical analysts see as an indication that the price will fluctuate a lot in the future.
Litecoin is currently trading above $111 in this pattern, but it will hit a major resistance level at $165. If the price breaks above this level in a big way, it might start a big bullish trend, with price goals of $225, $325, and maybe even $500 during a long bull cycle.
The support base of the triangle is about $85, which gives long positions a lot of protection. If this support level isn’t maintained, though, it might lead to a decline toward $61, which means that traders who are opening positions at these levels need to be very careful with their money.
Short-Term Technical Momentum Building Strength
The immediate price action indicates symptoms of bullish momentum growing, which is good news. The Relative Strength Index (RSI) is between 60 and 64, which means that upward pressure is getting stronger but not so strong that it reaches overbought levels, which usually happen before corrections.
The Moving Average Convergence Divergence (MACD) also just showed a bullish crossover, which means that the trend could continue. Litecoin has bounced back from intraday lows of about $108. Buyers keep showing up around the $110 mark, while resistance is emerging around $112.50.
If the price breaks through the $113-$115 resistance zone, it might start a short-term rally toward $120 and higher. Volume is still very important since trading must stay above these levels for a long time to keep prices from going back down to lower support zones at $109 or $95.
Market Structure and Institutional Interest Support Higher Valuations
The cryptocurrency market as a whole is stable above $3.8 trillion, which is good for altcoins like Litecoin that want to go better. Historical data demonstrates that LTC usually has high-beta traits during bull markets, and as momentum builds, it often gives big returns.
More and more people are talking about the possibility of a Litecoin ETF approval, which is another reason to be bullish. If institutional investors start buying Litecoin, it might raise demand and lower supply. This change would probably put LTC in the same category as Bitcoin and Ethereum as a popular way to invest.
The long-term trendline that was set in 2020 is still providing structural support. Analysts stress that respecting this channel keeps the overall bullish view. The technical foundation will be strong as long as Litecoin stays above the 50-day and 200-day moving averages.
Litecoin Price Prediction and Risk Assessment
According to current technical analysis, Litecoin looks like it might be ready to test the $132.63 resistance area, which it hasn’t been to in a few years. If Bitcoin keeps going up, this kind of success could lead to far bigger goals.
But experts say that if the price drops below the $105-$100 range, it might ruin the bullish scenario and lead to bigger declines toward $92 or $88. This kind of advance would break the 21-day Simple Moving Average near $101, which would make the immediate bullish case less strong.
Litecoin needs to stay above $105 in support and generate volume over the $115 resistance level for the best-case scenario to happen. The cryptocurrency may be getting close to a major turning point that could set its course for the rest of 2025. This is based on the convergence of technical indicators, historical trends, and rising market mood.
- Check out our free forex signals
- Follow the top economic events on FX Leaders economic calendar
- Trade better, discover more Forex Trading Strategies
- Open a FREE Trading Account
- Read our latest reviews on: Avatrade, Exness, HFM and XM
Related Articles


Sidebar rates
Related Posts
