Bitcoin Consolidates Above $118,000 as Technical Indicators Signal Major Breakout Ahead
Bitcoin (BTC) is still above the important $118,000 threshold, even though institutional demand from U.S. markets seems to be slowing down.

Quick overview
- Bitcoin remains above the critical $118,000 level, despite a slowdown in institutional demand from U.S. markets.
- The Coinbase Premium Index has turned negative for the first time since May, indicating mixed signals in institutional interest.
- Technical indicators suggest that Bitcoin may be poised for a significant price change, with volatility at an all-time low.
- Analysts predict a potential price target of $149,000, but caution that rising exchange reserves could signal upcoming selling pressure.
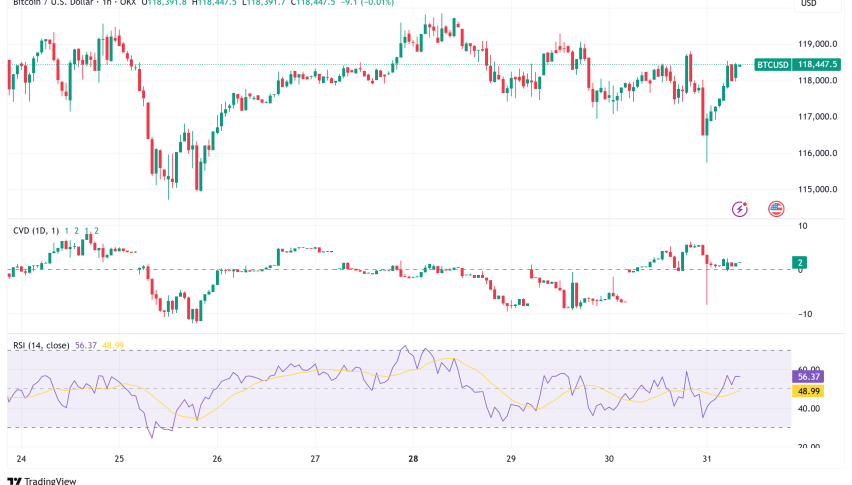
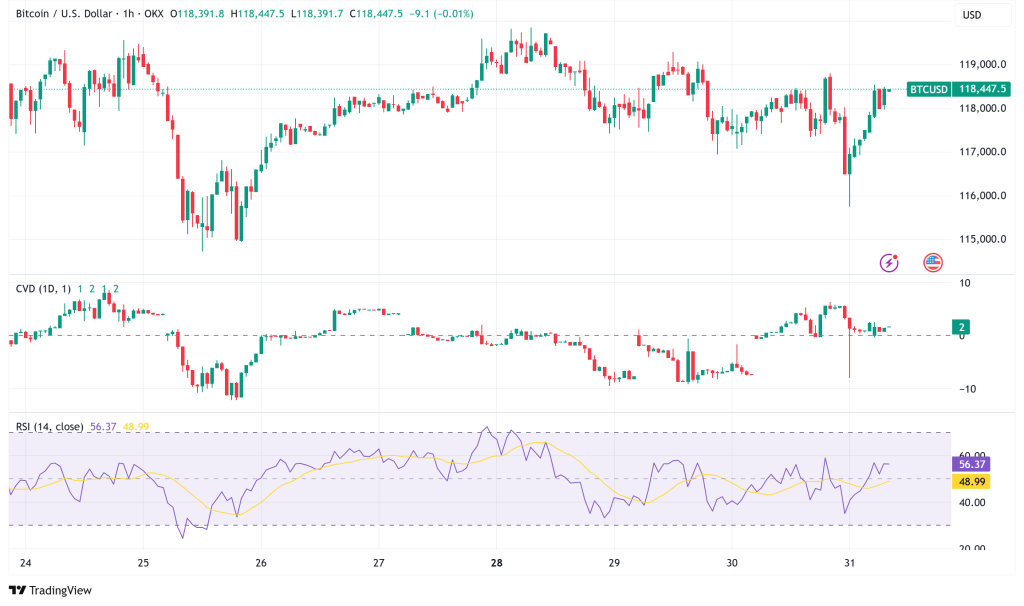
Bitcoin BTC/USD is still above the important $118,000 threshold, even though institutional demand from U.S. markets seems to be slowing down. The cryptocurrency has stayed rather consistent over the last 24 hours, hovering around $118,500. Several technical signs suggest that a big price change may be coming soon.

Institutional Demand Shows Mixed Signals
Bitcoin’s Coinbase Premium Index has gone negative for the first time since May 29, ending a 62-day string of positive readings. This metric shows the price difference between Coinbase’s BTC/USD and Binance’s BTC/USDT pairs. It is a vital sign of U.S. institutional demand. The change comes after a 94-day stretch of steady positive premium, which many observers say is the strongest period of institutional demand for Bitcoin on record.
Even while U.S. spot demand seems to be dropping off, onchain analyst Boris Vest says that Bitcoin’s ability to stay above $115,000 shows that bigger passive purchasers are stepping in to take up the selling pressure. The taker buy/sell ratio has dipped to 0.9, which means that market makers are selling more, but the price action is still very consistent.
Macro Environment Supports Risk Assets
The overall macroeconomic situation is still good for Bitcoin and other risky assets. The most recent U.S. Job Openings and Labor Turnover Survey (JOLTS) data was a little weaker than projected. This supports a “Goldilocks” scenario that usually helps cryptocurrency markets. Consumer confidence has also risen after falling for six months, which is a sign that investors are feeling better.
Notably, Bitcoin’s Net Realized Profit/Loss (NRPL) measure doesn’t show any signs of large-scale departures, and the Adjusted SOPR is still considerably below the 1.10 level that is usually seen during market tops. These signs point to the fact that investors still trust the way the market is set up now.
BTC/USD Technical Analysis Points to Compressed Volatility
Several technical indications are coming together to signal that Bitcoin may be getting ready for a big price change. Veteran analyst Titan of Crypto said that Bollinger Bands are “squeezing” on the daily chart and that volatility is at an all-time low. This compression, along with a falling Relative Strength Index (RSI), sometimes comes before big breakouts or collapses.
The futures cumulative volume delta (CVD) keeps showing strong selling pressure without causing prices to drop a lot, which experts call a “divergence between volume and price action.” The futures financing rate, on the other hand, stays at 0.01, which means that leverage is evenly distributed across the market.
Key Resistance and Support Levels Define Trading Range
A recent study from Glassnode says that Bitcoin is currently trading between important Short-Term Holder (STH) price bands. The STH Cost Basis is $105,400, and the current price is an 11.5% net gain for this group. The +1 standard deviation band at $125,100 has acted as a resistance point several times throughout the current cycle.
If Bitcoin breaks out of current range of trading between $105,000 and $125,000, analysts say the next big resistance level might be at $141,600, where the +2 standard deviation level will likely cause a lot of people to take profits.
In the short term, $118,620 is the first level of resistance, and the hourly chart shows a negative trend line. The most important support levels are at $117,500 and $116,250, and the $116,000 zone is the most important floor.
Bitcoin Price Prediction: $149,000 Target on Horizon
Several well-known analysts have come up with price targets based on current technical analysis. Ali Martinez says that Bitcoin’s next big top could be $149,679, based on the Cumulative Value Days Destroyed (CVD) indicator.
There are still some warning signs, though. Bitcoin exchange reserves recently hit a one-month high, which could mean that some holders are getting ready to sell. This could slow down the current upward trend.
Bitcoin is ready for its next big move as it goes through this consolidation phase. The next few weeks may be very important in deciding whether Bitcoin can break through its current resistance levels and reach new all-time highs above $140,000, or if it will have to go through a deeper correction toward the $113,500-$114,500 support zone.
- Check out our free forex signals
- Follow the top economic events on FX Leaders economic calendar
- Trade better, discover more Forex Trading Strategies
- Open a FREE Trading Account


