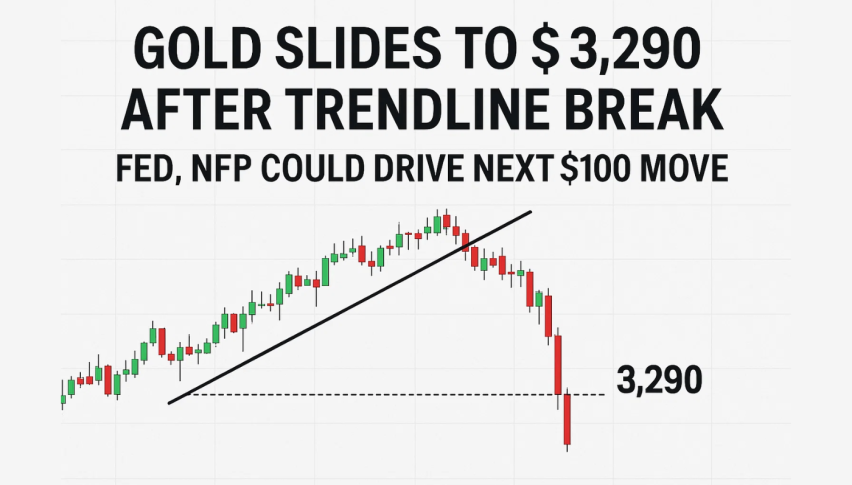
Gold Slides to $3,290 After Trendline Break – Fed, NFP Could Drive Next $100 Move
Gold is under pressure again. After slipping below $3,356 and losing the trendline, XAU/USD has settled at $3,291.
Quick overview
- Gold prices are under pressure, settling at $3,291 after breaking below key support levels.
- The Fed's decision to keep rates unchanged has led to uncertainty, pushing the US Dollar Index higher.
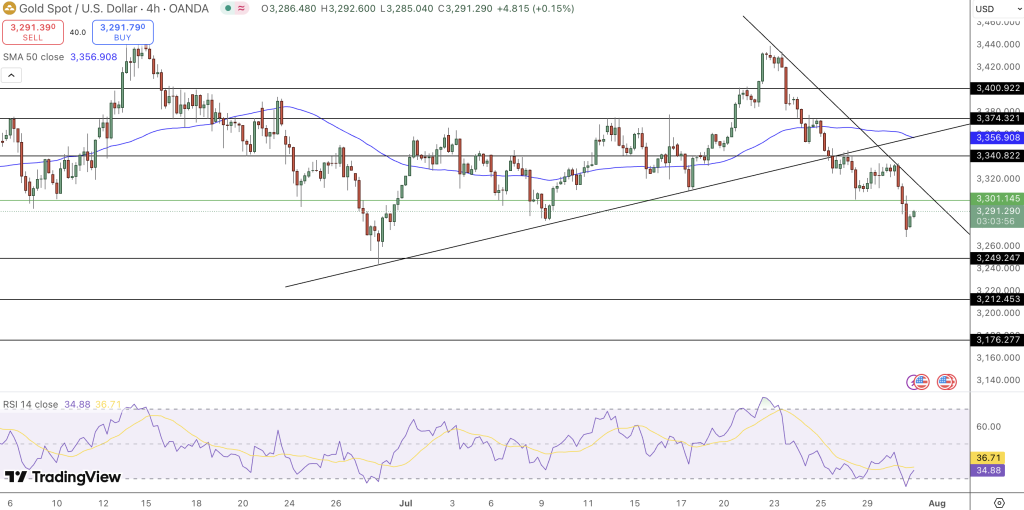
- Immediate support for gold is at $3,249, with critical resistance levels at $3,301 and $3,340.
- Upcoming economic data, particularly Non-Farm Payrolls, will be crucial in determining gold's direction.
Gold is under pressure again. After slipping below $3,356 and losing the trendline, XAU/USD has settled at $3,291. The move confirms the breakdown, driven by the change in sentiment after the Fed decided to keep rates unchanged on Wednesday.
While the Fed offered no new guidance, Jerome Powell’s cautious tone left traders wondering. Inflation is uneven and the labor market is mixed. That uncertainty has pushed the US Dollar Index (DXY) higher and gold below a key support cluster and into fresh downside risks.
Adding to the narrative was stronger than expected US GDP growth at 3.0% in Q2, which boosted the economy but dimmed hopes for near term rate cuts. At the same time, pending home sales fell and the GDP Price Index softened slightly – indicators that the Fed’s next move is still wide open.
Gold Key Levels to Watch as Momentum Fades
Technically, gold broke below the trendline and the 50-SMA at $3,356, which means the buyers lost control to the sellers. The failure to hold $3,301 confirmed follow through and now price is hovering at $3,291.
Immediate support is at:
- $3,249 – psychological and structural support
- $3,212 – May’s low
- $3,176 – March’s breakout zone
The RSI is below 40, which confirms weak bullish conviction. But there is a faint bullish divergence building, which could lead to a short term bounce if confirmed by price.
To change this bearish bias, bulls need to break above:
- $3,301 – minor resistance and intraday pivot
- $3,340 – near trendline
- $3,374 – 100-SMA and the breakdown origin
Until these levels are taken out, the path of least resistance is down.
FOMC and NFP Set the Stage for Friday
This week is shaping up to be critical for gold traders. With the Fed on hold and no forward guidance, attention now turns to data.
Here’s what to watch:
- Thursday: Core PCE (0.3%), Employment Cost (0.8%), Jobless Claims (222K)
- Friday: Non-Farm Payrolls (106K), Unemployment Rate (4.2%), Average Hourly Earnings (0.3%)
If NFP beats, it could confirm the economy is strong and extend the dollar’s rally – and put more pressure on gold. But if it’s weak, it could revive dovish expectations and help gold stabilize.
In Short:
Gold has broken technicals as macro gets intense. With momentum down and the Fed not helping, traders are bracing for a wild finish to the week. Whether gold gets back to $3,301 or goes below $3,249 depends on Friday’s NFP.
- Check out our free forex signals
- Follow the top economic events on FX Leaders economic calendar
- Trade better, discover more Forex Trading Strategies
- Open a FREE Trading Account
- Read our latest reviews on: Avatrade, Exness, HFM and XM
Related Articles
Sidebar rates
