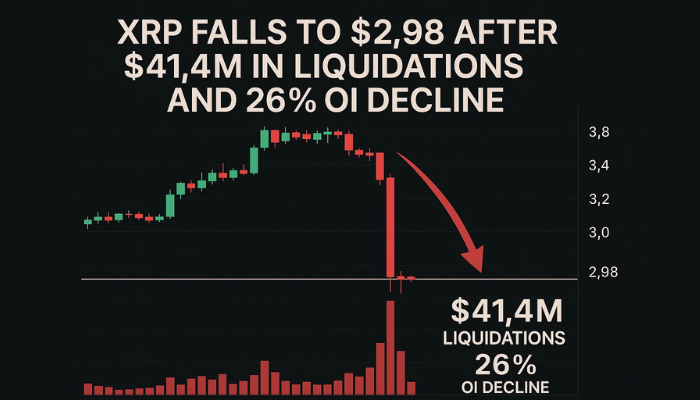
XRP Falls to $2.98 After $41.4M in Liquidations and 26% OI Decline
XRP is under pressure after 3 days of decline. Currently at $2.98, down 16% from the recent high of $3.66 on July 18.
Quick overview
- XRP has declined 16% to $2.98 after three days of selling pressure amid a broader crypto market downturn.
- In the last 24 hours, $41.4 million in XRP derivatives positions were liquidated, primarily from long positions.
- Technical indicators show weakness, with the RSI below 50 and a bearish MACD crossover suggesting potential further declines.
- Key price levels to watch include support at $2.77 and resistance at $3.32, with a cautious market sentiment prevailing.
XRP is under pressure after 3 days of decline. Currently at $2.98, down 16% from the recent high of $3.66 on July 18. The sell-off is part of a broader crypto market selloff and is causing losses for holders and derivatives traders.
According to CoinGlass, $41.4 million in XRP derivatives positions were liquidated in the last 24 hours. $39 million of that was long positions, showing how over-leveraged the bulls were. This drop in confidence is also reflected in XRP’s open interest (OI) which has dropped 26% to $8.13 billion from the July high of $10.94 billion.
Highlights:
- Price: $2.98 (16% off ATH)
- Liquidations: $41.4M (mostly longs)
- Open Interest: $8.13B (26% monthly drop)
This means traders are exiting positions fast and that will lead to lower liquidity and more volatility in the short term.
XRP/USD Technicals Show Weakness
XRP’s daily chart is pointing to more downside. The RSI has dropped from the overbought 88 to just below 50, indicating waning buying interest.
The MACD is bearish and the blue MACD line is below the red signal line. This negative divergence is a warning. XRP could test the 50-day EMA at $2.77 if selling continues.
Key Bearish Technicals:
- RSI: Below 50, buying power weakening
- MACD: Bearish crossover
- 50-Day EMA: Support at $2.77
With falling volume and open interest, XRP might enter a consolidation phase before the next move.
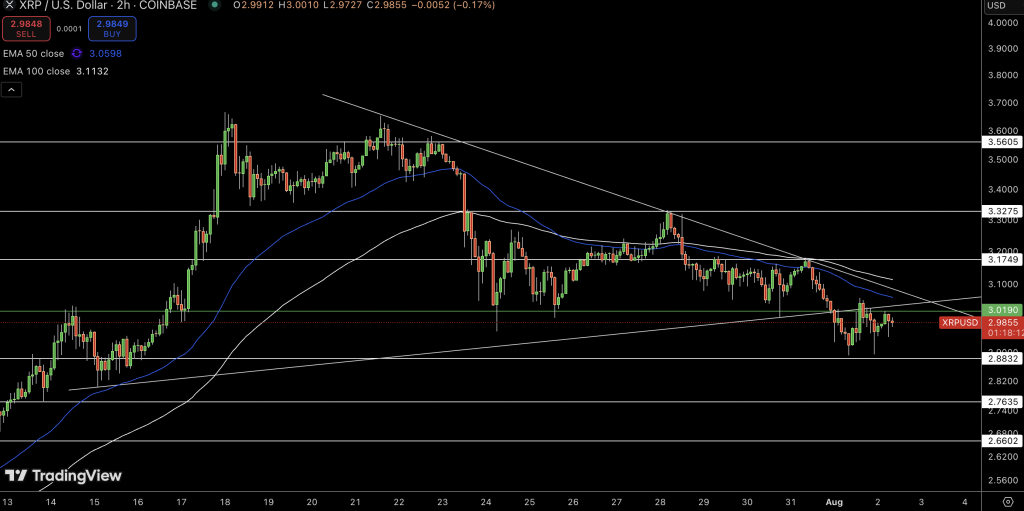
XRP/USD Range to Watch in August
Looking forward, XRP price will depend on if it can hold above $2.77, with $3.00 as the short term pivot. $3.32 is the next resistance. A break of either side could set the tone for August.Spot volume is $168 million, light and fading. This could be a chance for a slow rebound if spec interest comes back.
Levels to Watch:
- Support: $2.77
- Resistance: $3.32
- Pivot: $3.00
For now, XRP is in limbo, with a cautious tone in the market. Demand or broader sentiment change could change its direction—but for now, wait.
- Check out our free forex signals
- Follow the top economic events on FX Leaders economic calendar
- Trade better, discover more Forex Trading Strategies
- Open a FREE Trading Account