Ethereum Surges Above $3,500 as Record ETF Inflows Drive Bullish Momentum
Ethereum (ETH) is currently trading over the important $3,500 barrier. It has gained more than 3.5% in the last 24 hours. This is because
Quick overview
- Ethereum is trading above $3,500, having gained over 3.5% in the last 24 hours due to increased institutional interest through ETFs.
- Spot Ethereum ETFs have seen record inflows of $5.4 billion in July, indicating strong institutional adoption.
- On-chain activity has reached multi-year highs with 931,310 daily active addresses, reflecting renewed interest in Ethereum's ecosystem.
- Technical analysis shows mixed signals, with key support levels between $3,200 and $3,400, while the next resistance level to watch is $4,000.
Ethereum ETH/USD is currently trading over the important $3,500 barrier. It has gained more than 3.5% in the last 24 hours. This is because institutional investors are showing unprecedented interest in the cryptocurrency through exchange-traded funds. The latest price movement happens in a complicated technical environment that gives traders and investors both optimistic and bearish indications.
Record-Breaking Ether ETF Inflows Fuel Institutional Adoption
The most interesting story behind Ethereum’s recent rise is how well spot Ethereum ETFs have done. Luciano, a cryptocurrency trader, said that ETH ETFs had an amazing $5.4 billion in net inflows over a 20-day period in July. Outflows only happened on one day out of 31. This is the highest amount of institutional interest in direct Ethereum exposure that has ever been seen.
BlackRock’s ETHA ETF has become the most important participant in this area, with more than $4 billion in assets under management. The prolonged inflow trend suggests that institutional investors are increasingly recognizing Ethereum as a core digital asset allocation, notwithstanding broader market volatility. Even while technical indicators show a mixed picture, this institutional support gives ETH’s price action a strong fundamental base.
Ethereum’s On-Chain Activity Reaches Multi-Year Highs
Ethereum’s underlying network activity gives a strong story of expanding acceptance, in addition to price movement and ETF flows. There are now 931,310 daily active addresses, the most in almost two years. This huge rise in on-chain activity shows that people are once again interested in Ethereum’s ecosystem, which includes decentralized finance (DeFi) apps, non-fungible tokens (NFTs), and other blockchain-based services.
But more activity on the network can be a double-edged sword because it generally comes before times of high volatility. Historical patterns show that big price changes often happen at the same time as surges in daily active addresses. However, activity data alone cannot foretell which way these changes will go.
ETH/USD Technical Analysis Reveals Mixed Signals and Key Support Zones
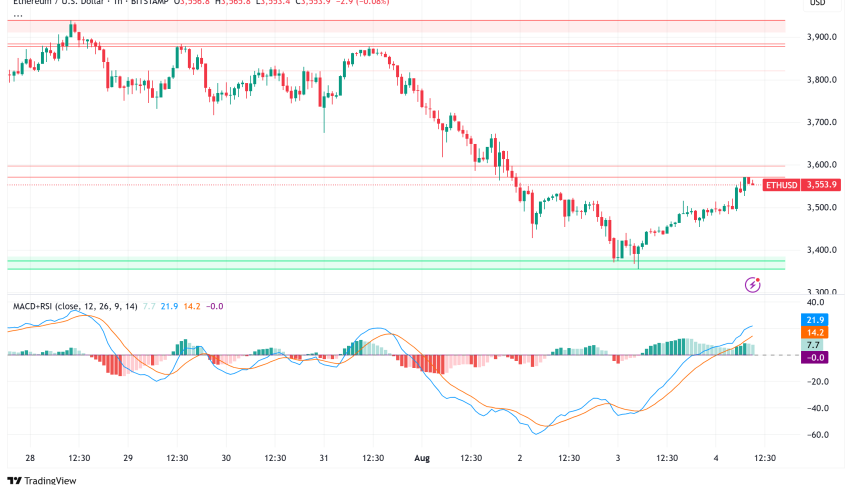
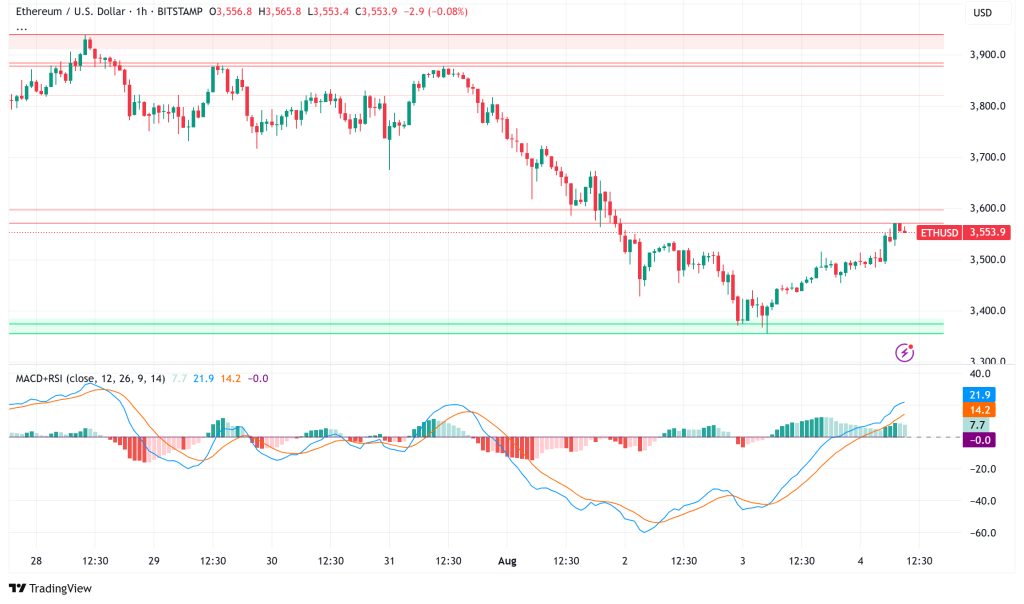
Ethereum’s chart shows a complicated picture from a technical point of view. It needs to be looked at from many different timeframes and indicators. ETH is currently trading at about $3,493 and has stayed above important support levels, although some analysts say it could be weak in the immediate future.
The Relative Strength Index (RSI) is showing bearish divergence, which is a bad technical pattern in which the price establishes higher highs but the momentum indicator doesn’t confirm these rises. This difference is frequently a hint that prices might change soon. The RSI is now at 53.63, having bounced back from being oversold but still being below positive zone.
The Moving Average Convergence Divergence (MACD) indicator backs up the cautious view even more. The MACD line is below the signal line, and the histogram readings are -70.44, which is an indication that the market is going down. This setup usually means that momentum is slowing down and there may be pressure to go down in the near future.
Critical Support and Resistance Levels Define Trading Range
Technical analysts have found a few important price zones that will probably decide which way Ethereum’s next big move will go. Based on past volume profiles and consolidation patterns, the main support zone between $3,200 and $3,400 is thought to have a 70% chance of generating a robust bounce.
If this level doesn’t hold, the next big support zone for buyers is between $2,950 and $3,100. However, analysts say there is only a 30% chance that ETH will reach these lower levels in the current market.
Market expert Michaël van de Poppe says that if bullish momentum returns, the $4,000 level will be the next key resistance level to watch. If this psychological barrier is broken, it might lead to more rises toward the previous cycle highs.
Ethereum Price Prediction and Market Outlook
Based on the current technical and fundamental situation, Ethereum seems likely to stay volatile in the near future. Record inflows into ETFs and more activity on the network are strong signs that the market will go up. However, technical indicators show that there may be a short-term consolidation or correction.
The most likely thing to happen is that ETH will test the support zone between $3,200 and $3,400 before possibly moving up to the resistance level of $4,000. Traders should still be on the lookout for breaks below important support levels, though, because these could lead to bigger corrections even though the fundamentals are good.
Some analysts think that Ethereum-related tokens might go up 20 to 50 times, although ETH itself has a market cap of around $420 billion, which makes it hard to do math. Realistic price goals for the established cryptocurrency are still lower, but the ongoing interest from institutions through ETF vehicles gives it a solid base for steady, long-term growth.
- Check out our free forex signals
- Follow the top economic events on FX Leaders economic calendar
- Trade better, discover more Forex Trading Strategies
- Open a FREE Trading Account
- Read our latest reviews on: Avatrade, Exness, HFM and XM
Related Articles
Sidebar rates
Related Posts
