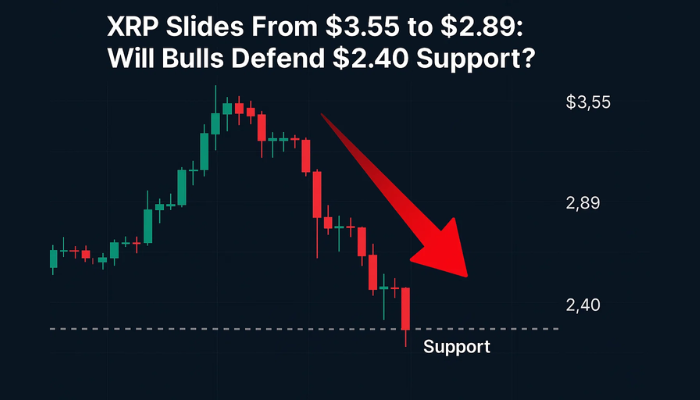
XRP Slides From $3.55 to $2.89: Will Bulls Defend $2.40 Support?
XRP has pulled back from $3.55 in mid-July and is now trading at $2.89. This 18% correction may still have some room to run.
Quick overview
- XRP has experienced an 18% correction from $3.55 to $2.89, with potential for further decline as a 3-day sell signal has been triggered.
- The next key support level to watch is $2.40, which previously acted as resistance and is part of XRP's earlier consolidation structure.
- Despite recent weakness, XRP's intraday structure shows signs of life with a breakout above key EMAs and a bullish engulfing candle.
- Traders should consider waiting for a retest at $3.03-$3.05 before entering, with targets set at $3.17 and $3.32.
XRP has pulled back from $3.55 in mid-July and is now trading at $2.89. This 18% correction may still have some room to run. According to Ali, the TD Sequential just triggered a 3-day sell signal, which historically catches trend exhaustion.
The TD Sequential is a momentum based tool that often signals reversals after extended rallies. In this case the signal appeared after XRP’s vertical move from sub-$2 levels. Now price action is validating the call with declining candles and weakening momentum.
Ali says $2.40 is the next potential landing zone. This level was previously resistance in June and is now support. It’s also the mid-range of XRP’s earlier consolidation structure—so it’s a level to watch for traders.
XRP/USD Technical Breakdown and Price Outlook
The technicals reveal more. Volume has faded throughout this pullback so it’s more profit taking than panic. RSI has cooled from overbought to neutral around 50 so it’s another move—up or down—without being stretched.
Candlestick patterns show a small bounce at $2.80 but so far no bullish reversal. If XRP fails to hold $2.80 and goes below $2.70, bears may target $2.40.
Key levels to watch:
- Support: $2.88, $2.76, $2.40
- Resistance: $3.05, $3.17, $3.32
- Indicators: RSI neutral, volume declining, no bullish divergence yet
While the bigger picture is still up, short term is shaky. EMAs on longer timeframes are still up so longer term investors are still confident but buyers need to step in soon to stop the bleeding.
XRP/USD Breakout Setup Above $3.05
Despite the weakness, XRP’s intraday structure is showing life. On the 2 hour chart XRP has broken out of the steep downtrend by going above the 50-EMA ($2.97) and 100-EMA ($3.03). This breakout was confirmed by a bullish engulfing candle—often a strong early sign of reversal.
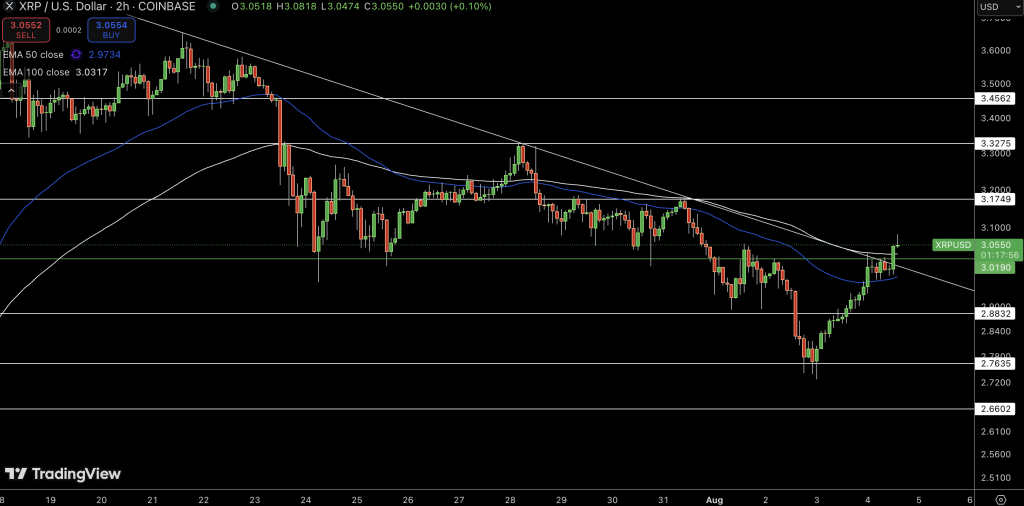
The setup looks good:* XRP has printed higher lows after bouncing at $2.76.
- RSI probably crossed above 50 during the breakout.
- Volume increased as XRP went above $3.05, a previous ceiling and EMA confluence zone.
If XRP can hold above $3.05 the next resistance levels to watch are $3.17 and $3.32.
Trade:
- Entry: Wait for retest and bounce at $3.03-$3.05
- Target 1: $3.17
- Target 2: $3.32
- Stop-Loss: Below $2.97 (50-EMA)
Always wait for confirmation candles. Chasing green can lead to failed entries.
- Check out our free forex signals
- Follow the top economic events on FX Leaders economic calendar
- Trade better, discover more Forex Trading Strategies
- Open a FREE Trading Account
- Read our latest reviews on: Avatrade, Exness, HFM and XM
Related Articles


Sidebar rates
Related Posts
