Tron Surpasses 323M Accounts as TRX Open Interest Jumps 6% to $522M
Tron (TRX) keeps going up, up 1% today, extending the uptrend that started in mid March. The growth story is backed...
Quick overview
- Tron (TRX) has increased by 1% today, continuing an uptrend that began in mid-March, supported by a growing ecosystem and DeFi adoption.
- Total Value Locked (TVL) on the Tron network rose by 1.41% in the last 24 hours, reaching $27.14 billion, indicating increased user activity and confidence.
- The TRX derivatives market shows growing trader confidence, with Open Interest in futures and options increasing by 6% to $522.10 million.
- Despite positive metrics, technical indicators suggest caution, with mixed momentum signals and key support and resistance levels to monitor.
Tron (TRX) keeps going up, up 1% today, extending the uptrend that started in mid March. The growth story is backed by the growing ecosystem and DeFi and stablecoin adoption.
According to TronScan, Total Value Locked (TVL) on Tron network increased 1.41% in the last 24 hours to $27.14 billion. This is a big jump in user activity and confidence, indicating broader adoption.
The network also hit a new high of 323 million total accounts and cumulative transfer volume of $20.28 trillion. Last week’s average stablecoin transfer volume was $160 billion, Tron is the king of stablecoin settlement.
Derivatives Market Shows Growing Confidence
TRX derivatives market is showing more and more confidence from traders. Open Interest (OI) in TRX futures and options increased by 6% in the last 24 hours to $522.10 million. This is a big increase in OI means:
- More traders participating
- More liquidity in TRX futures
- More willingness to take directional bets on price
This bullish momentum started with a 2% bounce on Sunday, which formed a V-shaped recovery. TRX went up 1.62% on Monday and continued to go up today.
If TRX breaks above $0.3385, it could retest the recent high of $0.3510 and confirm the bullishness.
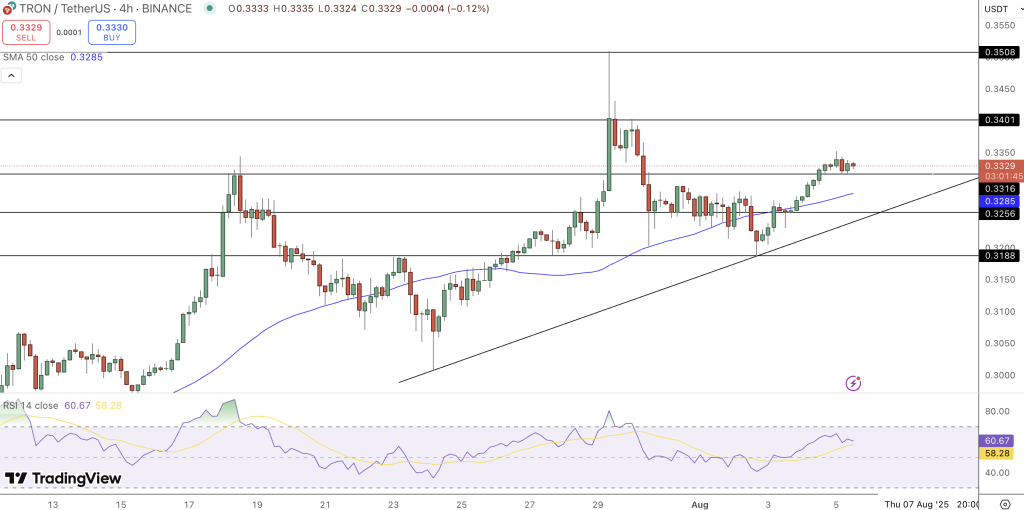
TRON Technical Indicators Warn of Caution
Despite the good network metrics, momentum indicators are mixed. RSI is diverging from price action and is below the overbought zone. This is a bearish divergence and means upward momentum is waning.
MACD is also sideways. The lack of separation between MACD and signal line means increased volatility and indecision among traders.
Key levels to watch:
- Support: $0.3187 — break below this and recent gains will be erased
- Resistance: $0.3510 — a test for the rally to continue.
- Check out our free forex signals
- Follow the top economic events on FX Leaders economic calendar
- Trade better, discover more Forex Trading Strategies
- Open a FREE Trading Account
- Read our latest reviews on: Avatrade, Exness, HFM and XM
Related Articles
Sidebar rates
Related Posts
