JSE Top 40 Hits 92,700 Before Pullback as Rand Rises and Tariffs Loom
According to Andre Cillier of TreasuryONE the rand is “recovering from Monday’s tariff blowout” but not without vulnerability.
Quick overview
- The rand is recovering from recent tariff challenges but remains vulnerable, with a potential trade deal impacting the short-term outlook for South Africa's export sectors.
- The JSE Top 40 index reached 92,700 before profit-taking, while the rand trades below R17.90 amid ongoing concerns about a 30% US tariff on exports.
- Investor uncertainty regarding the Federal Reserve's leadership is keeping the US dollar index flat, allowing emerging market currencies like the rand to gain some ground.
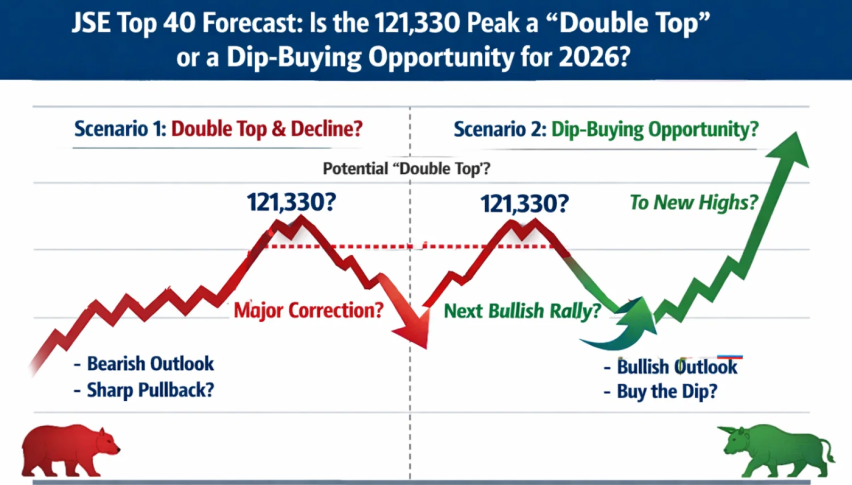
- The JSE Top 40 shows bullish short-term momentum but faces resistance at 92,762, with potential for consolidation or correction if momentum fades.
According to Andre Cillier of TreasuryONE the rand is “recovering from Monday’s tariff blowout” but not without vulnerability. A trade deal could change the short term outlook for South Africa especially for the export driven sectors.
Quick takeaways:
- JSE Top 40 touches 92,700 before profit taking
- Rand trades below R17.90
- 30% US tariff remains the headwind for exports
Fed Uncertainty Keeps Dollar in Check
The US dollar index is flat as investors wait for Fed leadership updates. President Trump has not yet named a successor for Fed Governor Adriana Kugler and there is speculation about a new Fed Chair. Investors are hesitant.
ETM Analytics notes “The USD is losing its exceptionalism” as weaker macro data and leadership uncertainty weighs on sentiment. This gives emerging market currencies like the rand room to recover.
At the same time the yield on the SA 2035 bond is up 3 basis points to 9.705% as investors are concerned about inflation and global interest rates. The bond market is cautious but equity sentiment is mildly bullish for now.
JSE Technicals: Resistance at 92,762
Technically the JSE Top 40 has recovered from the 0.786 Fibonacci retracement zone at 89,537 and broken above the 50 period SMA at 91,472. This is a clear series of higher lows and bullish in the short term. But that momentum is being tested.
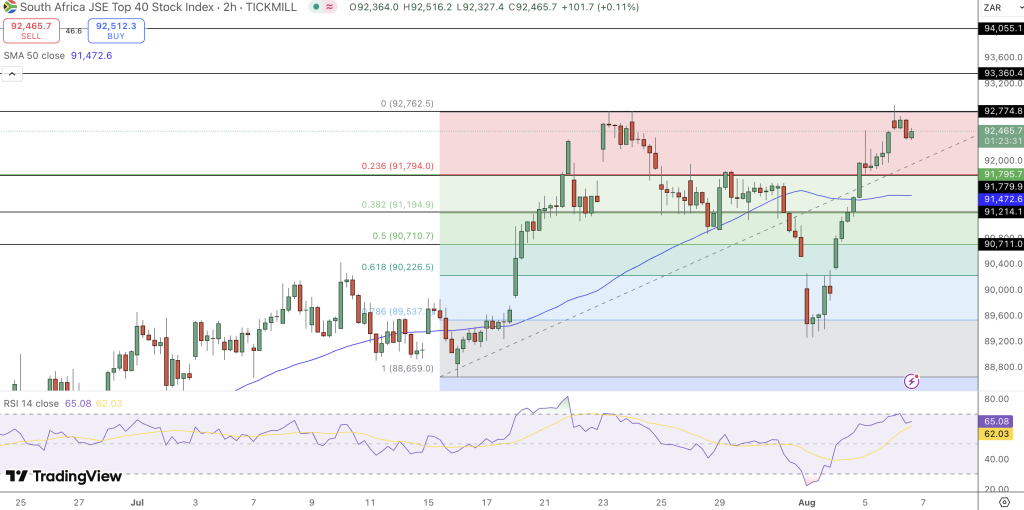
The index is looking tired at 92,762 resistance which is the 100% Fibonacci extension from the July highs. A long upper wick and narrow body candle is a reversal signal especially with the RSI at 65. This is a spinning top which often leads to consolidation or correction.
If momentum fades the 91,794-91,194 zone (Fibonacci cluster) is the first support to watch. A close below 90,711 would be bearish.
Trade Strategy:
- Short: Sell at 92,700, stop above 93,000, target 91,200
- Buy the dip: Wait for bullish candles at 91,200-91,400
- Confirmation cues: RSI below 60 for bears, or above 92,762 with RSI >70 for bulls
- Check out our free forex signals
- Follow the top economic events on FX Leaders economic calendar
- Trade better, discover more Forex Trading Strategies
- Open a FREE Trading Account
- Read our latest reviews on: Avatrade, Exness, HFM and XM
Related Articles


Sidebar rates
Related Posts
