MicroStrategy (MSTR) Faces Key Resistance Rejection at $430 — What’s Next?

Quick overview
- MicroStrategy (MSTR) has rebounded over 97% from recent lows, approaching a critical resistance level at $430.
- Despite the bullish trend indicated by the EMAs, momentum signals are mixed, with the MACD showing bearish tendencies.
- The RSI remains in neutral territory, suggesting potential for further movement but with caution as upward momentum may be exhausting.
- If MSTR breaks through the $430 resistance, the next target could be its all-time high near $543.
MicroStrategy (MSTR) has staged an impressive rebound, surging over 97% from its recent correction lows—nearly doubling in value. This strong recovery momentum, however, is now confronting a key resistance zone, which could determine whether the rally continues or stalls.
MicroStrategy (MSTR) Stock Testing Critical Resistance
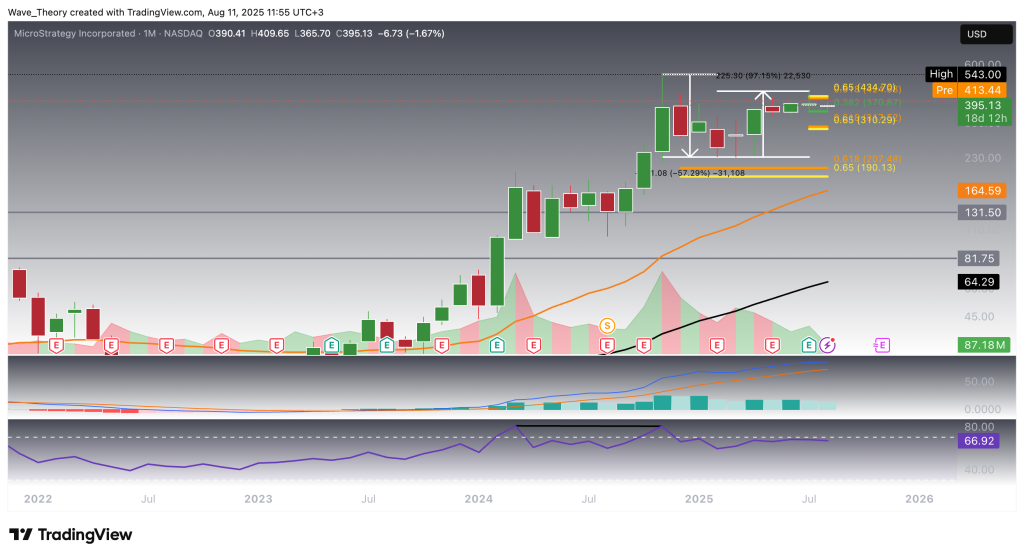
MicroStrategy (MSTR) has staged a remarkable rally, advancing more than 97% from its recent lows to retest the golden ratio resistance at $430, where it encountered notable rejection. Technically, the MACD histogram has been trending bearishly lower since last month, signaling a potential loss of momentum, although the MACD lines remain in a bullish crossover.
Meanwhile, the RSI is hovering just below overbought territory but continues to oscillate within neutral levels—suggesting room for further movement, albeit with caution as upward momentum approaches a potential exhaustion point.
From November to February, MicroStrategy (MSTR) saw a sharp 57% decline, nearly tagging the golden ratio support at $190—a level that continues to act as a strong long-term floor for price action.
MicroStrategy (MSTR) – More Bearish Signals On The Weekly Chart
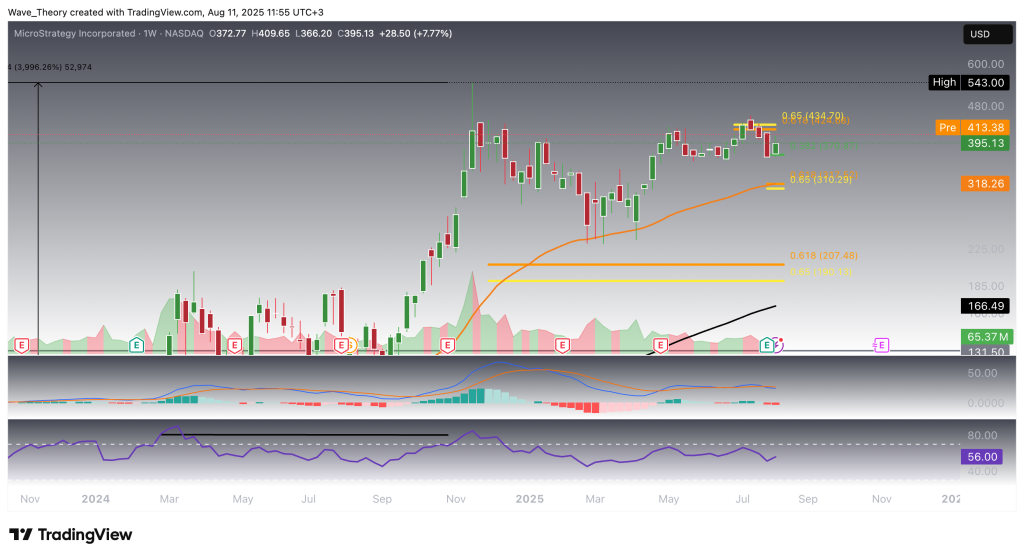
On the weekly timeframe, MicroStrategy (MSTR) maintains a golden crossover in its EMAs, keeping the mid-term trend technically bullish. However, momentum signals have begun to deteriorate—the MACD lines have recently crossed bearishly, and the MACD histogram has entered a clear downtrend.
The RSI remains in neutral territory, showing neither overbought nor oversold conditions. Following the bearish rejection at the golden ratio resistance at $430, price action is currently supported at the 0.382 Fibonacci retracement level near $370. A breakdown below this zone would likely open the door to the next major support at the golden ratio at $320, where the 50-week EMA converges as an additional reinforcement.
Mixed Signals on the Daily Chart for MSTR
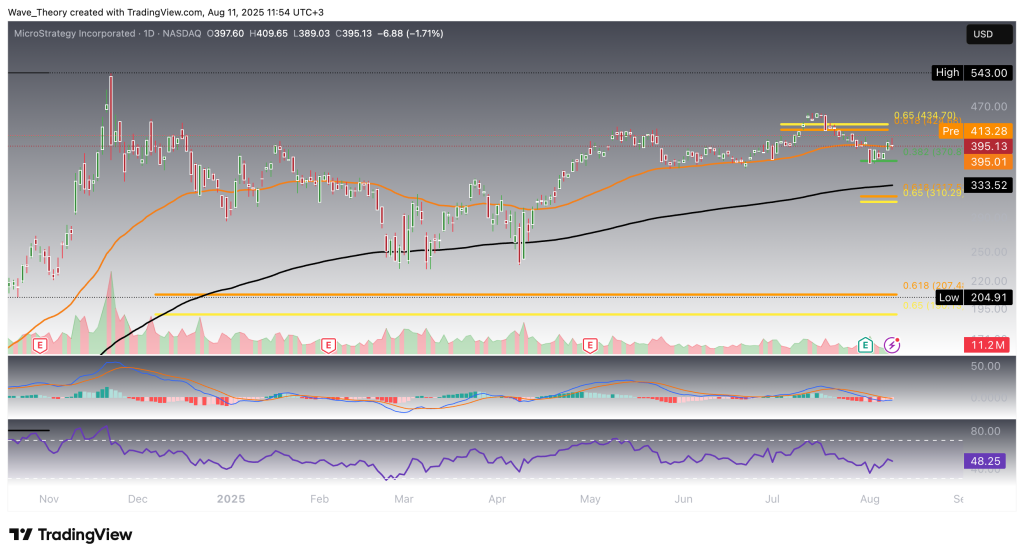
On the daily chart, MicroStrategy (MSTR) continues to display a golden crossover in its EMAs, affirming a bullish trend in the short- to medium-term. Momentum indicators, however, remain conflicted: the MACD histogram is ticking bullishly higher, while the MACD lines continue to hold a bearish crossover.
The RSI remains within neutral territory, reflecting balanced momentum without extreme conditions.
From a support perspective, should MicroStrategy breach its next Fibonacci support levels, it risks a deeper retracement down to the critical golden ratio support at $190, which historically serves as a strong long-term floor.
Mostly Bullish Signals on the 4H Chart
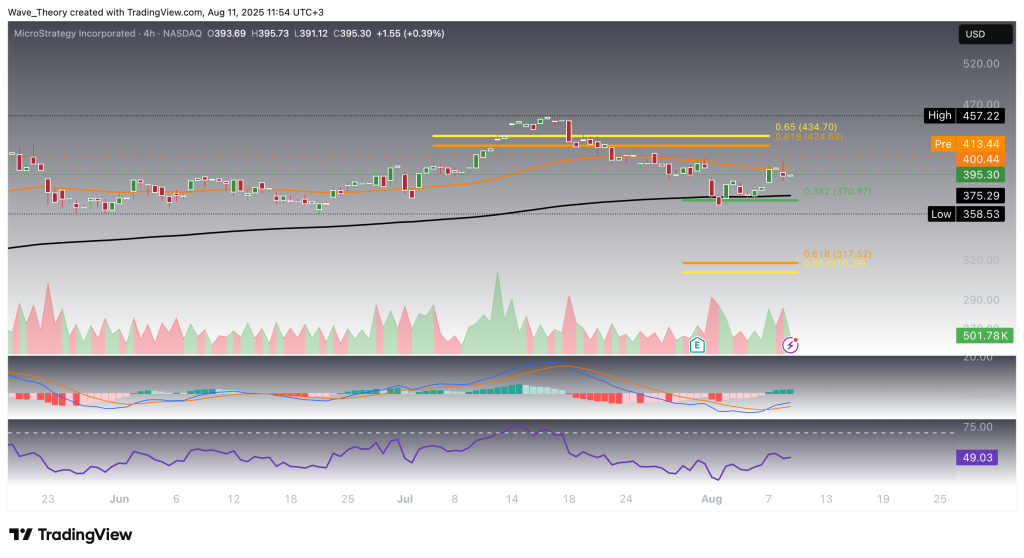
On the 4-hour chart, MicroStrategy (MSTR) shows a clear bullish setup. The MACD lines are bullishly crossed, accompanied by a rising MACD histogram indicating strengthening momentum. The EMAs also maintain a bullish crossover, confirming short-term upward trend strength.
Meanwhile, the RSI remains in neutral territory, providing no immediate bullish or bearish extremes.
If MicroStrategy successfully breaks through the golden ratio resistance at $430, the next logical target is its all-time high near $543.
- Check out our free forex signals
- Follow the top economic events on FX Leaders economic calendar
- Trade better, discover more Forex Trading Strategies
- Open a FREE Trading Account
- Read our latest reviews on: Avatrade, Exness, HFM and XM
Related Articles
Sidebar rates
