Bitcoin Eyes $137K Target, CPI Data Fuels Fed Rate Cut Speculation Above $119K Support
Bitcoin maintains strength above $119,000 as traders position for potential breakout amid growing expectations of Federal Reserve monetary
Quick overview
- Bitcoin remains above the critical $119,000 level, with traders optimistic about a potential rise to $137,000 following favorable inflation data.
- The recent Consumer Price Index data indicates a stable inflation rate, increasing the likelihood of the Federal Reserve cutting interest rates, which could benefit Bitcoin.
- Technical analysis shows a bullish flag pattern forming, with key resistance at $123,218 and support levels between $117,650 and $115,650.
- Market dynamics suggest a strong institutional interest in Bitcoin, but retail participation has not yet reached levels seen during previous significant price rallies.
Bitcoin BTC/USD is still holding strong above the important $119,000 barrier, and traders are becoming more hopeful about a possible rise to $137,000 after good inflation data that has made it much more likely that the Federal Reserve would cut rates. After a short test of $122,000, the world’s largest cryptocurrency is now consolidating. This might be the start of the next big leg of its historic ascent.
US Inflation Data Strengthens Bitcoin’s Macro Outlook
The release of the Consumer Price Index (CPI) statistics for July has greatly improved Bitcoin’s chances in the medium run. Inflation stayed at 2.7% year-over-year, the same as in June and lower than the expected 2.8%. More notably, the monthly CPI only went up 0.2%, down from June’s 0.3% figure. The core CPI, which doesn’t include food and energy, stayed at 3.1% per year.
The CME FedWatch shows that the chances of a rate decrease in September have gone up to an astonishing 93.9%. This data has completely changed what the Federal Reserve thought would happen. The possibility of lower interest rates is good for Bitcoin since it makes non-yielding assets like cryptocurrencies more appealing to both institutional and ordinary investors.
The next Producer Price Index (PPI) data, which is predicted to be 2.3% with Core PPI at 2.5%, might make this bullish macro scenario even stronger. A reading that is softer than expected would probably make people more sure that the Fed will ease monetary policy and could even bring in new money into risky assets.
BTC/USD Technical Analysis Points to Bullish Continuation Pattern
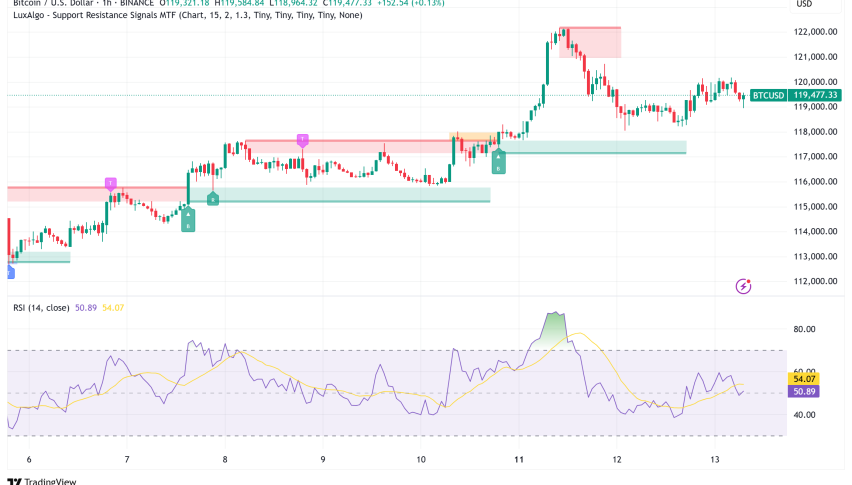
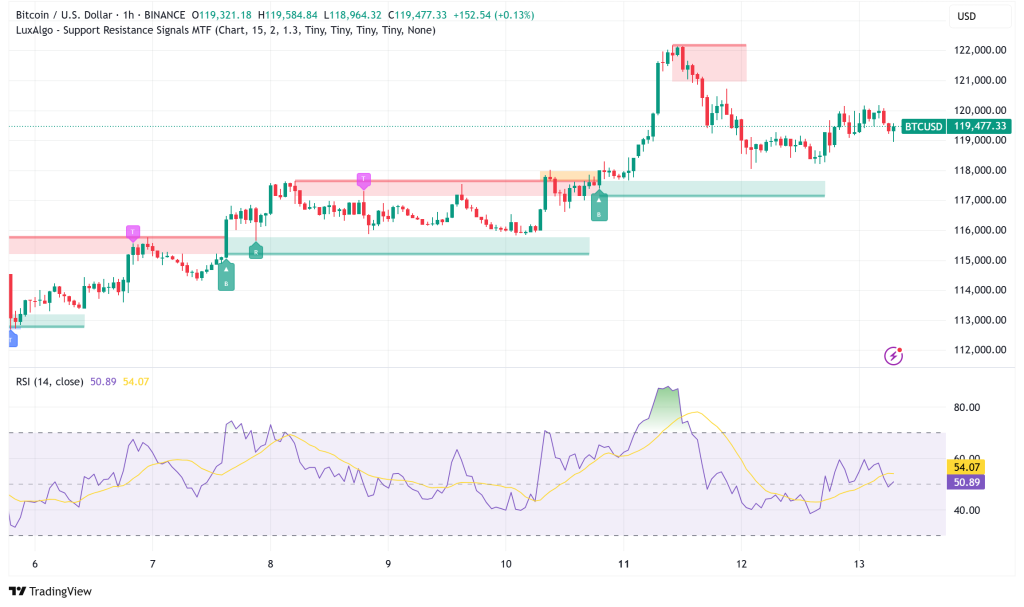
Bitcoin’s recent price movements signal the construction of a bullish flag pattern that has already broken to the upside on daily charts. The latest drop from Monday’s high of $122,190 to about $119,000 looks like a healthy retest of this breakthrough, giving traders a chance to set up positions before the next rise.
Titan of Crypto, a technical expert, has set a main objective of $137,000 based on a breakout of a descending trendline that happened over the weekend. This forecast fits with the larger bullish flag pattern aim of almost $130,000, which means that a number of technical indicators are pointing to the same positive goals.
The daily chart reveals that the 20-day simple moving average for Bitcoin is $116,779, which is an important support level. The relative strength index (RSI) is still above zero, which means that momentum is still on the side of buyers even though prices have been stable recently. A strong daily closing above $120,000 would be a historic event and could start the next wave of buying activity.
Critical Support and Resistance Levels Define Near-Term Outlook
The current technical situation of Bitcoin gives traders distinct levels to watch. The primary resistance zone is still above $123,218, which is the current all-time high and has been hard to break through. If this level is broken, it could quickly rise to $127,735 and then to the $135,000–$137,000 target zone.
On the other hand, support is clear between $117,650 and $115,650, which is where a CME gap occurred over the weekend. This sector is quite important for institutional futures traders who want to set up long bets. The 50-day simple moving average around $114,366 gives extra support, but if the price drops below $110,530, it could mean a bigger correction is coming.
Some experts, including ZAYK Charts, have warned against adopting the Wyckoff approach, saying that Bitcoin may have entered a distribution phase. If this is true, it might lead to a further decline that tests the $95,000 mark, which is where another big CME gap lies.
Bitcoin Exchange Volume Analysis Reveals Mixed Signals
On-chain analysis gives us more information about what is happening with Bitcoin’s price right now. BorisVest, an analyst at CryptoQuant, looked at Binance’s share of global trading volume. He found that while the exchange has almost twice as much trading activity as all other platforms combined, the overall market volume has not shown the big jumps that usually happen when prices reach all-time highs.
This concentration of trade activity makes me wonder about the participation of other markets. In the past, the strongest rallies have been backed by more trading on many exchanges, which shows that a lot of people believe in the market. The current pattern could mean that institutional interest is still high, but retail involvement hasn’t reached the levels that were seen during prior large breakouts.
Binary Coin Days Destroyed (CDD) data shows that long-term investors are not in a hurry to sell their positions, even while Bitcoin is trading close to all-time highs. This indicator, which keeps track of the movement of coins that have been sitting around for a long time, has gone down after a short surge. This means that selling pressure from established holders is still low.
Bitcoin Market Outlook: Gradual Ascent vs. Explosive Breakout
Analysts say that Bitcoin is following a “stair-step” rally pattern, which means that it is making steady gains with periods of consolidation in between. This method may be more sustainable than quick, speculative-driven rises since it lets short-term momentum die down while keeping the overall bullish trend going.
The fact that the cryptocurrency was able to stay over $119,000 after being turned down at $122,000 shows that the market is strong. The Federal Reserve’s policy expectations have changed to favor lower rates, and technical signs suggest that Bitcoin is in a good position to try to break to new highs again.
But reaching the $137,000 goal will probably depend on more people in the market and institutional demand staying strong. The next PPI data and comments from the Federal Reserve will be very important for figuring out if the present macro tailwinds can turn into the volume and momentum Bitcoin needs to make its next big move up.
- Check out our free forex signals
- Follow the top economic events on FX Leaders economic calendar
- Trade better, discover more Forex Trading Strategies
- Open a FREE Trading Account
- Read our latest reviews on: Avatrade, Exness, HFM and XM