Silver Price Forecast: $39 Breakout Stalls as Traders Await Fed September Cut
Silver stalled at $39.06 and is trading around $38.65 on Tuesday. Technicals show momentum building in a symmetrical...
Quick overview
- Silver is currently trading around $38.65, with technical indicators showing momentum in a symmetrical triangle pattern.
- Fed Chair Jerome Powell's comments at the Jackson Hole symposium suggest a potential rate cut in September, impacting market sentiment towards metals.
- Key US economic data this week will influence silver's price direction, with stronger GDP or inflation likely pushing silver down, while weaker data could support a rise.
- Silver's immediate resistance is at $39.06, and a daily close above this level could lead to further gains, while a drop below $38.11 may trigger a decline.
Silver stalled at $39.06 and is trading around $38.65 on Tuesday. Technicals show momentum building in a symmetrical triangle pattern but broader market sentiment is tied to Fed expectations.
At the Jackson Hole symposium, Fed Chair Jerome Powell said the US economy is in a “tough spot”. He noted inflation risks are high, employment is softening—opening the door to a September rate cut. CME’s FedWatch Tool shows 84.3% chance of at least 25bps cut vs 61.9% a month ago.
Lower rates are bullish for metals as it reduces the opportunity cost of holding non-yielding assets like silver and gold. That’s given metals a floor even as the US Dollar is strong on risk-off flows.
Key US Data This Week
Traders will be watching US data this week which could tighten up market expectations before the September Fed meeting. Tuesday has the Conference Board’s Consumer Confidence, Durable Goods and the Richmond Fed Manufacturing Index. Later in the week is 2Q GDP and the July PCE Price Index, the Fed’s preferred inflation gauge.
- Stronger GDP or hotter inflation → Dollar up, silver down
- Weaker growth or cooler inflation → Easing bets up, silver up
The interplay between these data and Fed signals will determine if silver breaks higher or fades.
Silver (XAG/USD) Technical Outlook: Silver at a Crossroads
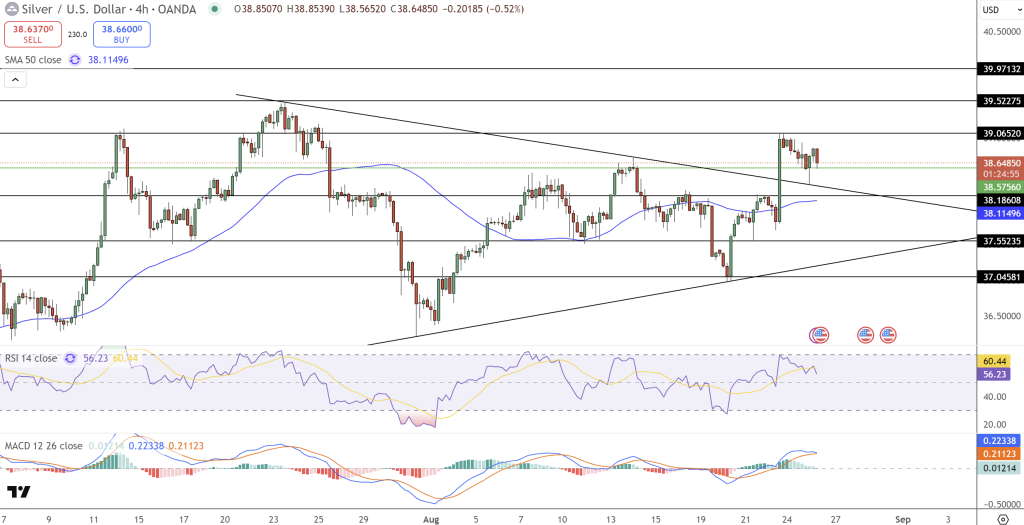
Technically silver is capped by the $39.06 resistance zone where last week’s rally was rejected by a long upper wick—often a sign of weakening buying. The 50-SMA at $38.11 is immediate support, the RSI at 56 has cooled off from overbought, leaving room for another push if buyers come back in.
Momentum indicators are neutral. The MACD is positive but flat, with histogram bars just above zero, it’s a sign of indecision not a trend reversal. A broader pattern of higher lows since mid-August shows underlying demand is still strong.
For traders:
- Above $39.06 exposes $39.52 and $39.97
- Below $38.18-$38.11 could see a drop to $37.55 and $37.04.
Silver (XAG/USD) Trade Outlook:
Conservative bulls wait for a daily close above $39.06 to go higher. Aggressive traders look for short term bounces at $38.11 support zone.
In short, silver’s next move is dependent on Fed signals and US data to break above $39.06 or sellers to take control near resistance.
- Check out our free forex signals
- Follow the top economic events on FX Leaders economic calendar
- Trade better, discover more Forex Trading Strategies
- Open a FREE Trading Account
- Read our latest reviews on: Avatrade, Exness, HFM and XM
Related Articles

Sidebar rates
Related Posts
