Bitcoin to Test $100K Support Amid Labor Day Volatility and Whale Selling Pressure?
Bitcoin (BTC) is trading above $107,000 as of Labor Day Monday. This is a drop of more than 1.3% in the last 24 hours. Analysts say that the
Quick overview
- Bitcoin is currently trading above $107,000, experiencing a drop of over 1.3% in the last 24 hours.
- Analysts warn that if Bitcoin falls below the critical $100,000 support level, the ongoing bull market may be at risk.
- Despite selling pressure from whales and a decrease in ETF purchases, institutional demand for Bitcoin remains strong.
- Short-term technical indicators show potential for a bullish reversal, but the market dynamics suggest further downward movement may occur.
Bitcoin BTC/USD is trading above $107,000 as of Labor Day Monday. This is a drop of more than 1.3% in the last 24 hours. Analysts say that the world’s biggest cryptocurrency is at a critical point and that the whole bull market might be in danger if key support levels don’t hold.
The current price movement shows that there is a lot of pressure coming from several places, such as the fact that traditional markets are closed for Labor Day, whales are still selling, and technical indicators show that prices will stay poor in the near term.
BTC Whale Activity Creates Market Overhang
One of the biggest worries for Bitcoin investors is the original Bitcoin whales would sell a lot more of their coins. People in the market are keeping a careful eye on whale-sized wallets that have been inactive for a long time but are now active again. Some big transactions have already turned Bitcoin profits into Ethereum (ETH).
This whale activity is happening at the same time that fewer people are buying spot Bitcoin ETFs, which has caused an imbalance between supply and demand that has led to the recent drop in prices. Bitcoin bulls are having a hard time since institutional buying through ETFs is down and early adopters are selling more.
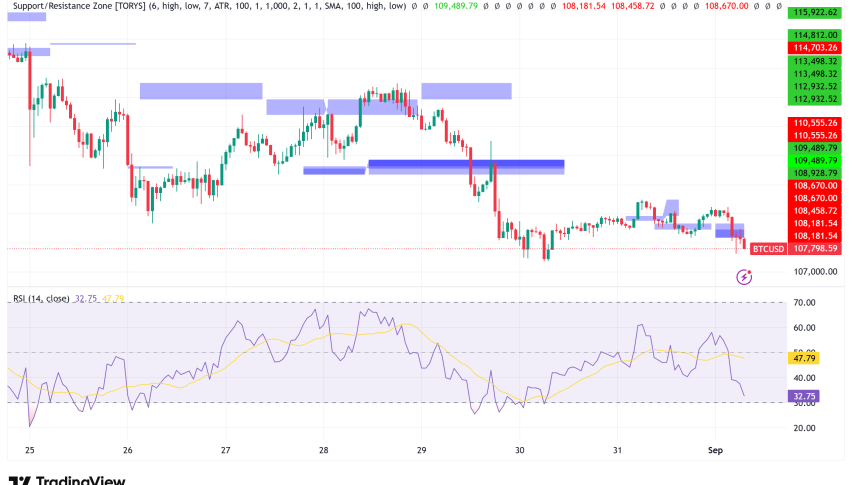
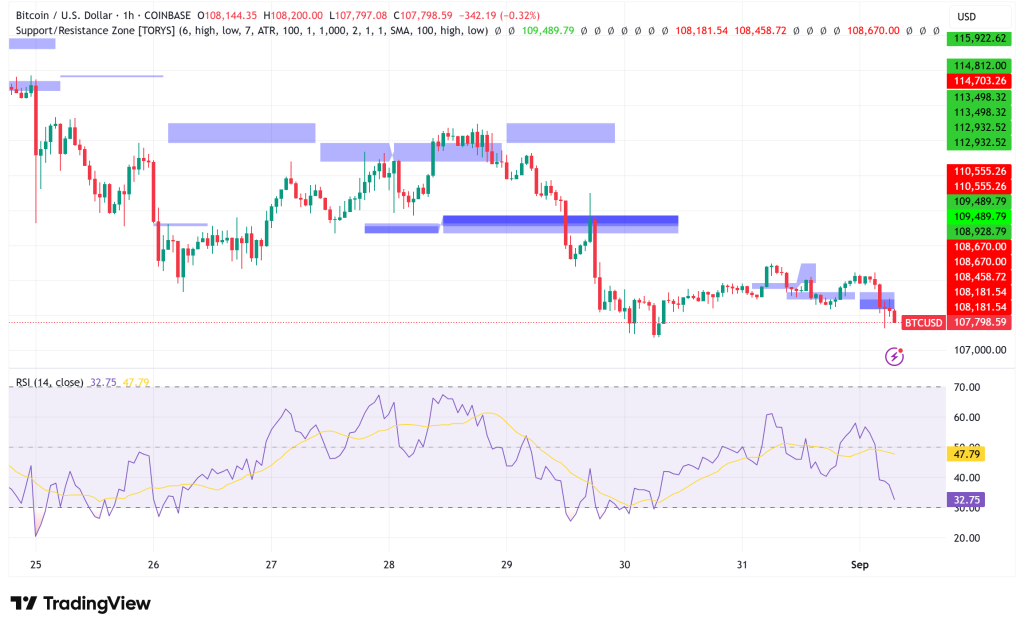
BTC/USD Technical Analysis Points to Bearish Momentum
When it comes to technical analysis, the activity in the perpetual futures market is what is mostly moving the price of Bitcoin. Data from Hyblock shows that the cumulative volume difference demonstrates that selling from the 10,000 to 10 million group on Binance is going more faster than buying in both the spot and futures markets at major exchanges like Binance and Coinbase.
The liquidation heat maps don’t look good for bulls; the biggest liquidity cluster is at $104,000 on the downside. Short-term orderbook data shows that there is more bid support at $105,000, $102,600, and $100,000. There is also deeper support down to the $99,000-$92,000 region.
Roman, a well-known trader, has given a strong warning: if Bitcoin drops below the important $100,000 support level, its bull run would be “officially” finished. The analyst says that Bitcoin has already lost its upward momentum and the $112,000 support level. This means that the $98,000-$100,000 zone is the most important level.
Mixed Signals from RSI Indicators
Some analysts are finding grounds to be cautiously optimistic in shorter time frame indications, even though the overall technical picture seems bearish. Four-hour charts are starting to show a bullish divergence on the Relative Strength Index (RSI). This is a sign that a possible uptrend reversal may be coming.
Trader ZYN pointed out a weekly RSI bullish divergence, saying that “a new ATH in the next 4–6 weeks is on the table” if current support levels hold. But this positive view depends on Bitcoin being able to protect important support areas.
Institutional Demand vs. Market Dynamics
Even though there is a lot of selling pressure right now, the underlying fundamentals show that institutions still want to buy Bitcoin. River says that private and public companies are buying Bitcoin almost four times quicker than miners can make new coins. In 2025, they will buy an average of 1,755 BTC per day.
When you add in ETF purchases (1,430 BTC per day) and government purchases (39 BTC per day), the overall institutional demand is far more than the 450 BTC that miners make every day. This imbalance between supply and demand has caused Bitcoin exchange balances to drop to their lowest levels in years.
In the second quarter of 2025, Bitcoin treasury corporations, led by MicroStrategy’s huge 632,457 BTC holdings, bought 159,107 BTC. MicroStrategy’s treasury officer, on the other hand, says that their OTC buying approach is meant to have as little effect on the spot market as possible.
Bitcoin Price Prediction and Near-Term Outlook
Bitcoin looks like it could go down much more in the short future because of the way the market is set up and how it works right now. The fact that the markets are closed on Labor Day, that whales are still selling, and that the futures market is negative all point to a possible challenge of the $105,000 level, with stronger support between $102,000 to $104,000.
Michaël van de Poppe, a crypto expert, thinks that the $102,000-$104,000 range is the greatest place to buy more, even though the market is expected to go down in the medium term.
The important level is still $100,000. If it doesn’t hold, it could mean that the market has reached a high and the current bull cycle is over. However, if this level holds up and bullish RSI divergences start to show up, it could lay the ground for a recovery that takes the market to new all-time highs in the following 4–6 weeks.
- Check out our free forex signals
- Follow the top economic events on FX Leaders economic calendar
- Trade better, discover more Forex Trading Strategies
- Open a FREE Trading Account
- Read our latest reviews on: Avatrade, Exness, HFM and XM
Related Articles


Sidebar rates
Related Posts
