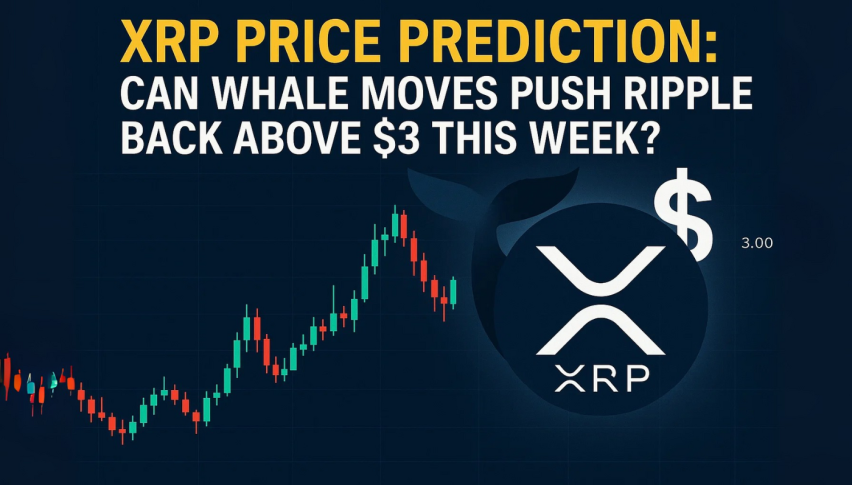
XRP Price Prediction: Can Whale Moves Push Ripple Back Above $3 This Week?
XRP is trading at $2.80, down 1.3% in the last 24 hours, well below the July 2025 high of $3.70. Market cap is $167.1 billion...
Quick overview
- XRP is currently trading at $2.80, down 1.3% in the last 24 hours, with a market cap of $167.1 billion.
- Institutional adoption is increasing, but retail participation remains weak, and technical indicators suggest a potential floor at $2.50.
- A recent $700M transfer to Kraken has sparked whale accumulation rumors, while AI predictions suggest XRP could reach $5 by Q4 2025.
- Traders should watch for a breakout above $2.87 for bullish momentum or a rejection that could lead to further declines.
XRP is trading at $2.80, down 1.3% in the last 24 hours, well below the July 2025 high of $3.70. Market cap is $167.1 billion, 4th largest. Daily volume is $5.6 billion but liquidity has dried up compared to earlier this year and it’s unclear if bulls can mount a sustained rally.
The broader narrative is complicated. Institutional adoption is growing but retail participation is weak. Technicals point to $2.50 as the floor; if broken, could lead to deeper corrections.
Whale Moves and AI Optimism
Market was shaken this week by a $700M XRP transfer to Kraken, sparking whale accumulation rumors. Large inflows to exchanges have preceded both big drops and surprise rallies. Analysts say consolidation between $2.50 and $2.85 could be the setup for the next breakout.
Adding to the intrigue, China’s DeepSeek AI is calling for XRP to hit $5 by Q4 2025 citing institutional demand and correlation with Ethereum’s highs. While AI models should be taken with a grain of salt, they do move retail sentiment and fuel positioning.
Key signals to watch:
- Whale transfers: $700M to Kraken means accumulation.
- RSI levels: 45, weak momentum.
- AI models: DeepSeek targets $5 by end of 2025.
- Bitcoin correlation: If BTC breaks $115,000, altcoins could ride the wave up.
XRP/USD Technical Outlook and Trade Setup
On the 2-hour chart, XRP is stuck below the descending trendline from late August. Repeated failures at $2.87 show strong resistance, 50-EMA ($2.82) and 200-EMA ($2.89) above and bearish bias is intact.
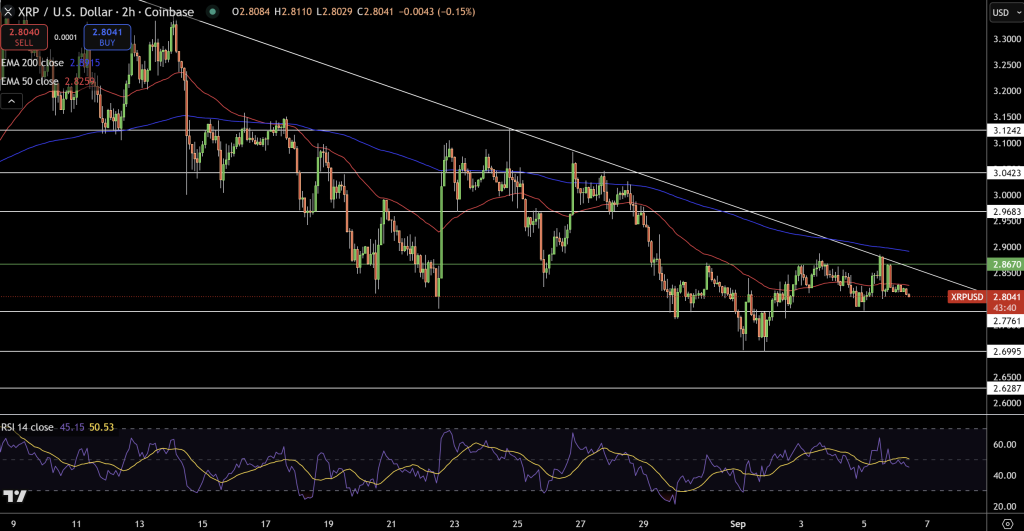
Candlesticks are indecisive: Doji and spinning tops dominate, hesitation is the name of the game, and lower highs confirm supply is in control. RSI is 45, no buying power and no bullish divergence to suggest reversal.
For traders:
- Bullish scenario: Break above $2.87, confirmed by a bullish engulfing candle and strong volume, could lead to $2.96 and $3.04.
- Bearish scenario: Rejection at resistance could lead to $2.77, then $2.70 and $2.62.
For newbies, think of XRP as a spring under pressure. Until it breaks free, sellers are in control. Aggressive traders might try to catch the breakout above $2.87, while more conservative investors will wait for confirmation before getting in. Stop-loss below $2.77 to manage risk.
- Check out our free forex signals
- Follow the top economic events on FX Leaders economic calendar
- Trade better, discover more Forex Trading Strategies
- Open a FREE Trading Account
- Read our latest reviews on: Avatrade, Exness, HFM and XM
Related Articles


Sidebar rates
Related Posts
