Gold Price Holds $3,632 as Traders Watch Fed Cuts, Dollar Moves, and Chart Signals
Gold (XAU/USD) is trading around $3,632 after easing from last week’s $3,673 peak. The metal came under modest selling pressure in Asia...
Quick overview
- Gold (XAU/USD) is currently trading around $3,632 after a peak of $3,673 last week, facing selling pressure due to strong equity markets and a firmer U.S. dollar.
- Despite the recent pullback, expectations of Federal Reserve interest rate cuts next week may support gold prices and limit downside risks.
- Silver has also seen a slight decline to $41.04, as investors weigh monetary policy easing against ongoing geopolitical risks.
- Technical analysis indicates key support levels for gold at $3,615-$3,626, with potential for a bounce if these levels hold.
Gold (XAU/USD) is trading around $3,632 after easing from last week’s $3,673 peak. The metal came under modest selling pressure in Asia as strong equity markets reduced safe-haven demand, while a firmer U.S. dollar added slight headwinds. Still, downside risks remain limited because traders expect the Federal Reserve to cut interest rates next week, a move that could cap dollar gains and support bullion.
Silver echoed the move, slipping 0.30% to $41.04, as investors balanced the pullback against expectations for easier monetary policy and ongoing geopolitical risks.
Fed Outlook Supports Bullion
The latest U.S. data reinforced the case for policy easing. The Producer Price Index fell to 2.6% year-on-year in August from 3.3% previously, while core PPI eased to 2.8% from 3.7%. Softer inflation pressures highlight weaker demand, and markets now expect up to three quarter-point rate cuts this year, with a chance of a larger move at the September 17 meeting.
This dovish outlook has kept dollar strength in check, helping gold hold above key support despite short-term selling. Traders are watching closely, as sustained easing could open the door for another rally toward record levels.
Gold (XAU/USD) Technical Levels to Watch
The 2-hour chart shows early signs of consolidation after the rally. Prices are testing trendline support near $3,626, where Fibonacci retracement lines also converge. Key observations:
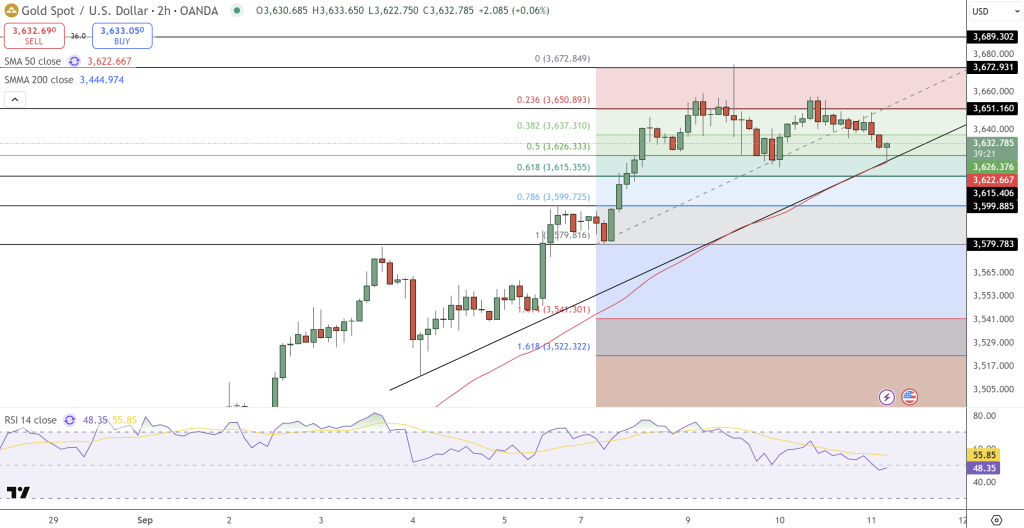
- 50% retracement: $3,626
- 61.8% retracement: $3,615
- 50-SMA: $3,622 as near-term support
- RSI: Cooling near 48, showing loss of momentum without oversold conditions
Candlestick signals point to hesitation, with spinning tops and a doji reflecting indecision. If buyers defend $3,615-$3,626, gold could bounce toward $3,651 and $3,672. A break below $3,615, however, risks deeper losses to $3,579 and $3,541.
- Check out our free forex signals
- Follow the top economic events on FX Leaders economic calendar
- Trade better, discover more Forex Trading Strategies
- Open a FREE Trading Account
- Read our latest reviews on: Avatrade, Exness, HFM and XM
Related Articles


Sidebar rates
Related Posts
