Gold Price Forecast: XAU/USD Targets $3,689 as Rate-Cut Bets Lift Demand
Gold (XAU/USD) is holding at $3,654 after bouncing off the 0.382 Fibonacci level at $3,637. US inflation is sticky...
Quick overview
- Gold (XAU/USD) is currently priced at $3,654 after rebounding from the 0.382 Fibonacci level at $3,637.
- US inflation remains persistent, with CPI rising 0.4% month-over-month, leading traders to anticipate rate cuts and boosting gold demand for the fourth consecutive week.
- Physical gold demand in Asia is weakening, with Shanghai prices $17 below London spot and Indian prices up over 50% year-over-year, dampening pre-festival buying.
- Technically, gold shows a bullish trend with a higher-low structure and key Fibonacci levels indicating potential targets of $3,673 and $3,689.
Gold (XAU/USD) is holding at $3,654 after bouncing off the 0.382 Fibonacci level at $3,637. US inflation is sticky, with CPI up 0.4% m/m vs 0.3% expected, and unemployment claims up to 263,000. Traders are now pricing in rate cuts sooner, which has underpinned safe-haven demand and gold for the 4th week in a row.
In Asia, physical demand is cracking. Shanghai gold is $17 below London spot for the 2nd week in a row, indicating weak jewelry buying. In India, domestic prices are up over 50% yoy and have dampened pre-festival season demand.
Gold Technicals
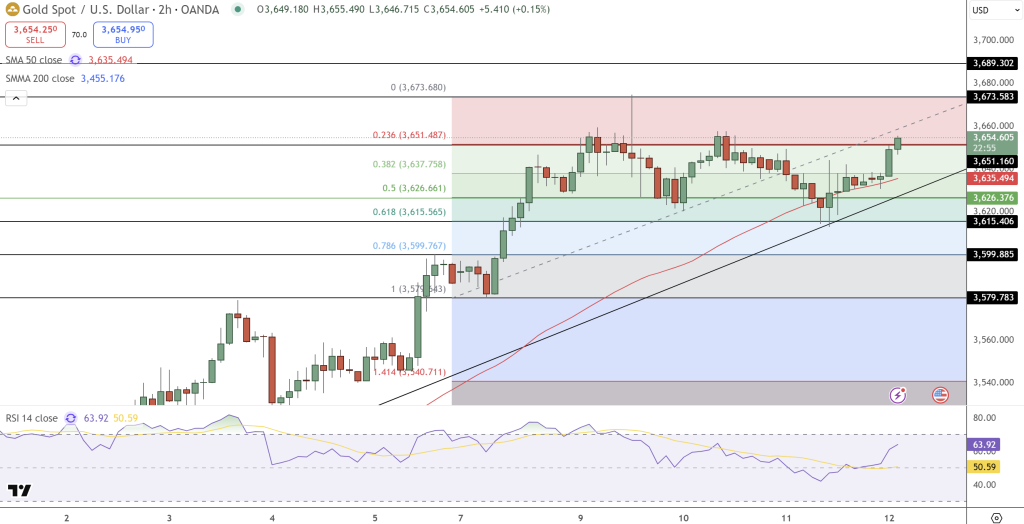
From a technical perspective, gold has built a higher-low structure since early September, guided by an uptrend line. The 50-EMA at $3,635 is supporting short-term, the 200-EMA at $3,455 is supporting the bigger picture.
Candle action is bullish: a bullish engulfing candle reclaimed $3,650, showing buyer conviction. RSI is at 64, below overbought, so room for more upside. Fibonacci levels are key, $3,615 is the defensive floor, $3,673-$3,689 is the immediate target.
Gold Trade Setup and Outlook
For traders, a long entry is favored above $3,651, with targets at $3,673 and $3,689. Stop below $3,615. The setup is based on higher lows, EMA alignment and supportive momentum, all of which is bullish.
If gold breaks $3,689, momentum could take it to $3,700 and beyond, extending its run as a hedge against sticky inflation and policy uncertainty. For new traders, this means gold’s bounce may not be just a pause, it could be the start of the next leg higher.
- Check out our free forex signals
- Follow the top economic events on FX Leaders economic calendar
- Trade better, discover more Forex Trading Strategies
- Open a FREE Trading Account
- Read our latest reviews on: Avatrade, Exness, HFM and XM
Related Articles

Sidebar rates
Related Posts
