Adobe Stock: How a $10,000 Investment Turned Into Over $33 Million in 40 Years

Quick overview
- Adobe Inc. has seen its stock surge over 337,791% in the past 40 years, turning a $10,000 investment into over $33 million.
- Recently, Adobe's stock has declined by approximately 43%, approaching critical support levels at $280.6 and $250.
- Technical indicators show mixed signals, with bullish momentum from the MACD but bearish death crosses on both weekly and daily charts.
- Adobe is at a pivotal point where maintaining long-term support could lead to a recovery, while failure may result in further declines.
Adobe Inc. (NASDAQ: ADBE) is a global leader in digital media and creativity software, best known for its flagship products such as Photoshop, Illustrator, Premiere Pro, and Acrobat. Beyond its Creative Cloud suite, Adobe has expanded into digital marketing, analytics, and document management, positioning itself at the core of both creative industries and enterprise solutions. Over the past 40 years, Adobe has delivered a remarkable long-term uptrend, but more recently the stock has begun to show signs of struggle.
Adobe Inc. (ADBE) Stock Surged By Over 337,791 % Over The Past 40 Years
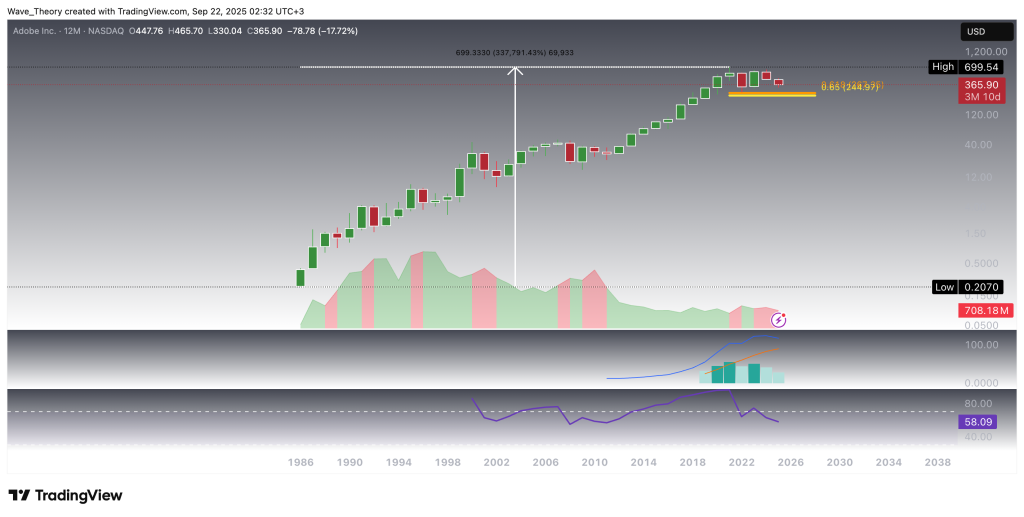
Over the past 40 years, Adobe’s stock has surged by more than 337,791%. To put this in perspective, an initial investment of $10,000 in the mid-1980s would be worth over $33 million today. Even after adjusting for inflation, the return remains extraordinary, underscoring Adobe’s ability to deliver long-term shareholder value. That said, while the company has experienced a remarkable multi-decade uptrend, its stock has recently begun to face headwinds.
Five years ago, Adobe’s stock entered a major retracement phase, pulling back from its peak near $700 to the golden ratio support at $250. From that level, the stock staged a strong bullish rebound. However, over the past two years, price action has gradually retraced once again toward this critical $250 golden ratio support, placing the stock at a decisive long-term juncture. With that, the MACD histogram ticks bearishly lower since last year, although the MACD lines remain bullishly crossed. Meanwhile, the RSI hovers in neutral regions.
Adobe Stock Dropped By 42.6 % Over The Past Months
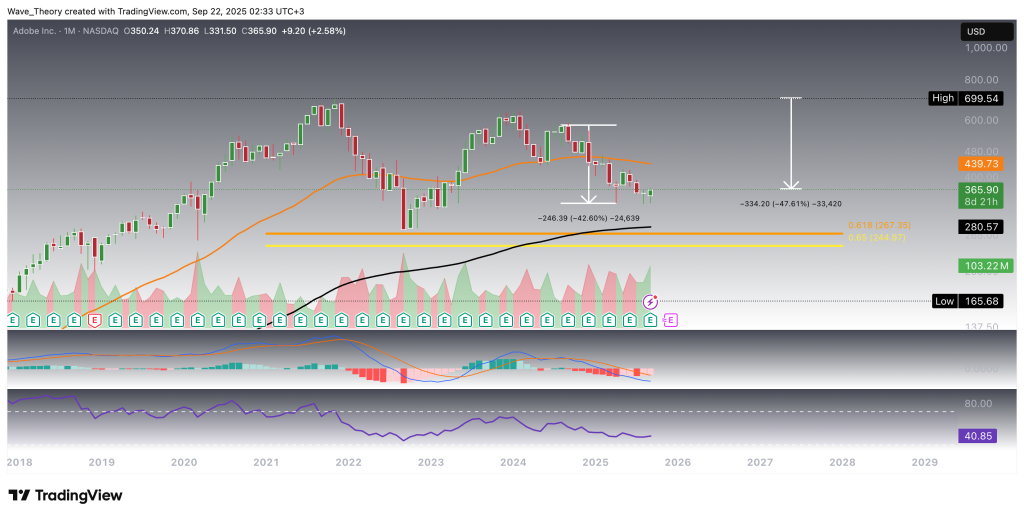
Adobe’s stock has recently declined by roughly 43%, bringing it close to the golden ratio support confluence with the 200-month EMA at $280.6. Despite this retracement, the long-term EMAs remain bullishly crossed, maintaining the broader structural uptrend. Momentum signals, however, are mixed: the MACD histogram has been trending higher since last month, suggesting improving momentum, while the MACD lines remain in a bearish crossover. The RSI sits in neutral territory, offering no clear directional signal.
From a broader perspective, ADBE remains 47.6% below its all-time high near $700, underscoring the depth of its ongoing correction despite the preservation of long-term bullish structure.
Emerging Death Cross On The Weekly Chart
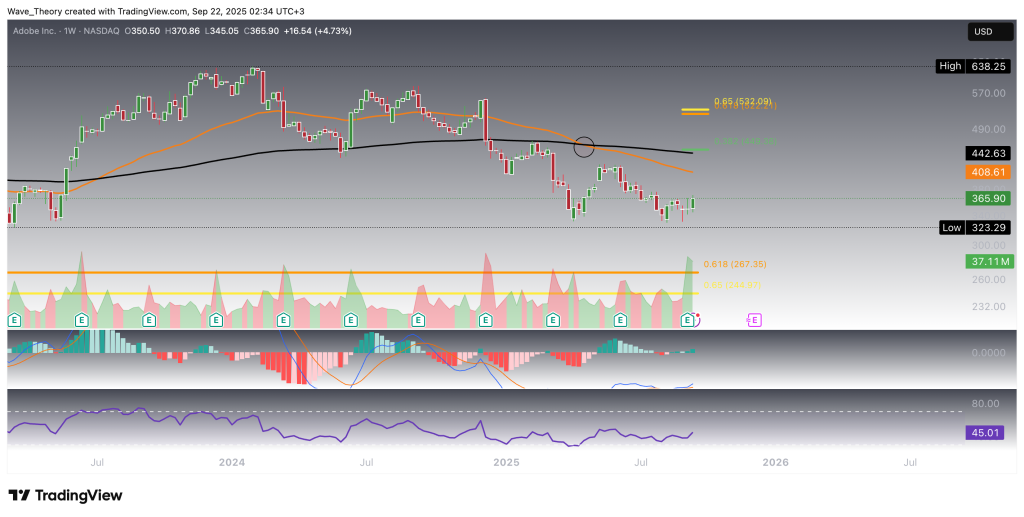
The weekly chart for Adobe presents mixed technical signals. On the momentum side, the MACD lines remain in a bullish crossover, and the MACD histogram continues to tick higher, suggesting positive momentum is building. At the same time, the RSI is neutral, providing neither bullish nor bearish confirmation. In contrast, the EMAs have established a death cross, which confirms a bearish mid-term trend bias.
Should Adobe initiate an upward movement despite these headwinds, the stock will encounter its next major Fibonacci resistance levels at $449 and $532, which will serve as key tests for the strength of any recovery rally.
Similar Outlook On The Daily Chart
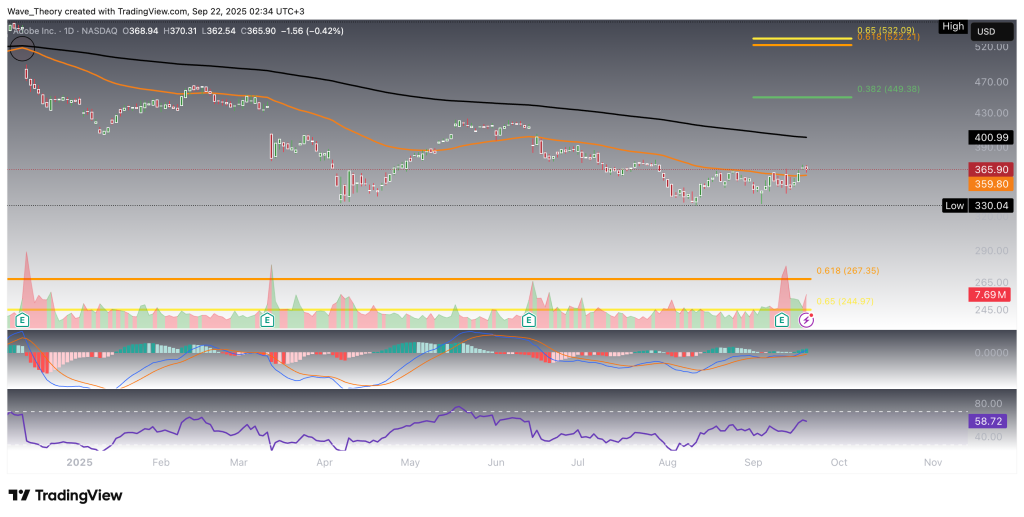
On the daily timeframe, the EMAs have also formed a death cross, confirming a bearish bias in the short- to medium term. That said, momentum indicators show a more constructive picture: the MACD lines remain in a bullish crossover, the MACD histogram is trending higher, and the RSI sits in neutral territory without signaling extremes.
Price action has also shown strength, with the stock breaking above the 50-day EMA resistance at $360. This breakout could pave the way for a continuation move toward the next key resistance at the 200-day EMA around $401.
Adobe Inc. (NASDAQ: ADBE) – Technical Summary
Adobe remains in a prolonged correction, currently trading nearly 48% below its ATH near $700. Price has retraced toward the golden ratio support at $280.6 (confluent with the 200-month EMA), a decisive long-term level.
-
Support levels: $280.6 (200-month EMA), $250 (major golden ratio).
-
Resistance levels: $360 (50-day EMA, recently broken), $401 (200-day EMA), $449 & $532 (weekly Fib resistances), $700 (ATH).
Momentum is mixed across timeframes: the MACD histogram trends higher, and the MACD lines are bullishly crossed, but the EMAs show death crosses on both weekly and daily charts, confirming mid-term bearish structure. The RSI remains neutral across timeframes.
Overall, Adobe sits at a critical juncture—holding long-term support could trigger a recovery toward key resistances, while failure would risk deeper downside.
- Check out our free forex signals
- Follow the top economic events on FX Leaders economic calendar
- Trade better, discover more Forex Trading Strategies
- Open a FREE Trading Account
- Read our latest reviews on: Avatrade, Exness, HFM and XM