USD/CAD Hits 1.3828: Rising Wedge Signals Potential Drop to 1.3737
USD/CAD nears 1.3828 as CAD struggles post-BoC rate cut. Rising wedge, RSI divergence, and key U.S. PMI data could trigger drop toward 1.373
Quick overview
- USD/CAD has risen to 1.3828 due to weakness in the Canadian dollar following a recent rate cut by the Bank of Canada.
- A rising wedge pattern indicates potential trend exhaustion, while bearish divergence on the RSI suggests weakening momentum.
- A break below the key level of 1.3817 could confirm a bearish move, with targets set at 1.3797 and 1.3737.
- Traders should consider a stop-loss near the resistance zone of 1.3850 and monitor upcoming economic data for potential market shifts.
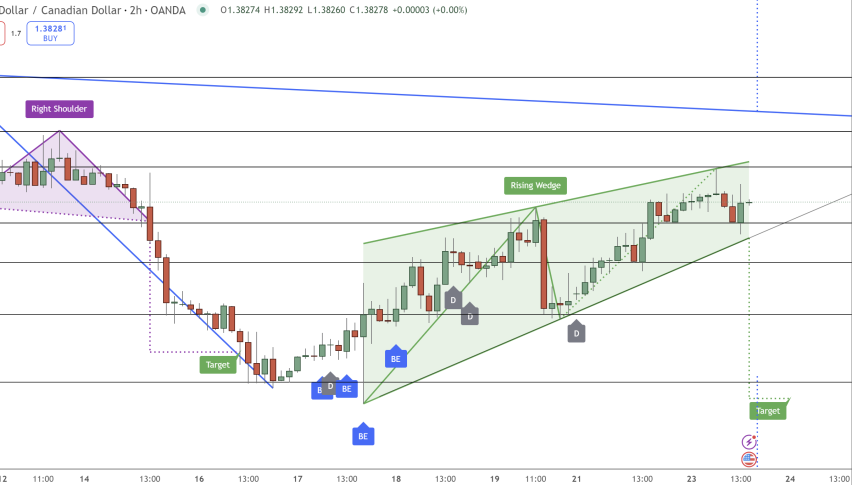
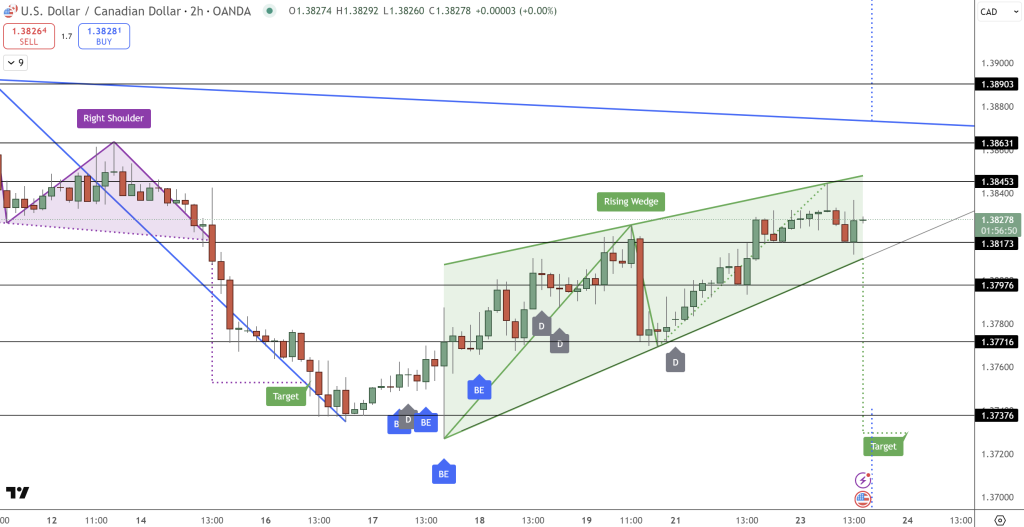
During Tuesday’s European session, USD/CAD climbed to 1.3828, reflecting growing softness in the Canadian dollar. The Bank of Canada (BoC) recently slashed its policy rate by 25 basis points to 2.50%, its first cut in six months, amid signs of labor-market deterioration and weaker inflation. Markets are now pricing in another possible rate cut in October.
Meanwhile, the U.S. dollar remains broadly cautious ahead of key Federal Reserve Chair Jerome Powell comments and upcoming U.S. PMI data. The takeaway: USD/CAD’s upside appears more driven by CAD’s struggles than by sudden USD strength.
Rising Wedge & Technical Pressure
From a chart-pattern view, USD/CAD formed a head-and-shoulders pattern earlier this month and broke down, targeting 1.3770 before bouncing. Since then a rising wedge has developed—a structure often seen as a warning sign in uptrends.
Price action sits just above support at 1.3817, with upper-wick rejections, doji and spinning-top candles, indicating buyer hesitation.
The RSI flattened in the mid-50s despite slight highs in price, hinting at bearish divergence. The 50-EMA and 200-EMA are converging, raising the possibility of a crossover if downside momentum strengthens.
USD/CAD Trade Strategy + Risk Setup
For beginners: technicals suggest a trade opportunity for short-position if USD/CAD drops below 1.3817 with conviction.
Key targets would be 1.3797, then 1.3737 if bears take control. Set a stop loss above ~1.3850 to protect against a reversal. Watch candle patterns—look for bearish engulfing or three black crows for confirmation.
Also monitor Powell’s speech and U.S. flash PMI: strong data could derail downside, weak data might accelerate it.
Bullet Points: What to Watch
-
Rising wedge pattern signals potential trend exhaustion
-
Bearish divergence on RSI: price higher highs not matched by momentum
-
Key level: break below 1.3817 confirms bearish move
-
Resistance zone near 1.3850 offers stop-loss candidate
- Check out our free forex signals
- Follow the top economic events on FX Leaders economic calendar
- Trade better, discover more Forex Trading Strategies
- Open a FREE Trading Account
- Read our latest reviews on: Avatrade, Exness, HFM and XM
Related Articles


Sidebar rates
Related Posts
