Orion Minerals Price Forecast: Can ORN Break 22c on Path to 25c?
Orion Minerals holds at 22c after rallying from 15c, with support at 20c and upside toward 25c. Stable rand and firm rates add to South Afri

Quick overview
Orion Minerals Ltd (JSE: ORN) closed at 22.00c on Tuesday after rallying from 15c earlier this month, as investors continue to buy into the Johannesburg-listed mining company. The stock is looking good, but now faces a test at the 22c resistance zone.
The broader SA market was steady. The Top-40 index didn’t move much and the rand was firm against the majors, so it’s a supportive environment for local shares. Investors are waiting for economic data this week, including the PPI and the central bank’s quarterly bulletin to get a sense of the growth trajectory.
Rand and SA Economic Signals
The rand was flat on Tuesday, waiting for the big economic releases. The PPI is expected to be 1.5% year-on-year, the same as July, and the leading business cycle indicator will give more insight into the near term outlook.
The rand was stable after the Reserve Bank left the repo rate at 7%. Economists at Nedbank expect the quarterly bulletin to show stronger household finances in Q2 due to higher wages, lower inflation and lower debt. That’s good for disposable income growth and investor confidence.
Bond markets agreed, with the 2035 yield down 3.5bps to 9.13%. That’s a good environment for investors to look at SA shares, including Orion Minerals.
Orion Minerals Technical Analysis: Orion at a Crossroads
From a technical perspective, Orion Minerals has gone from 15c to 25c and then paused at 22c. The move formed a textbook three white soldiers candlestick pattern, showing strong conviction. But the stock has since hesitated and failed multiple times to break 23.6% Fibonacci at 22.
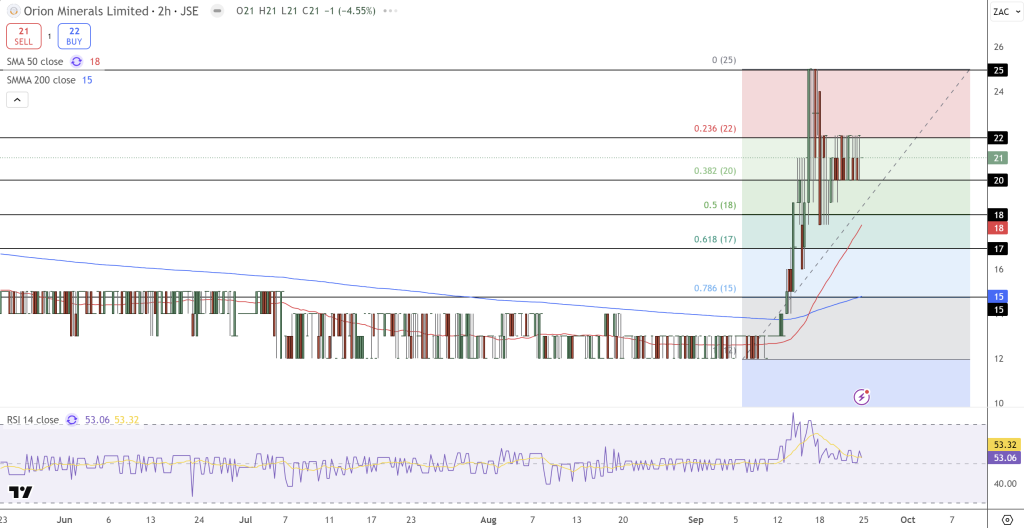
Momentum has cooled. The RSI has come back from overbought to 53, so it’s consolidation rather than exhaustion. Support is at 20c, the 38.2% Fibonacci and the 50-day moving average, and deeper support at 18c.For now Orion is making higher lows on the short term trendline.
A break above 22 would be bullish continuation and open up 24-25c. Below 20 would be a break and 18 would be the target, where reversal candles like a spinning top or bullish engulfing pattern could get buyers back in.
Trade: Traders may find it’s worth waiting here. Long on a clean break above 22 to 24 and 25, with stop at 20. Or dip buyers could look to get in near 18 if support holds. Until then Orion is in a classic inflection zone where candlestick confirmation will decide direction.
- Check out our free forex signals
- Follow the top economic events on FX Leaders economic calendar
- Trade better, discover more Forex Trading Strategies
- Open a FREE Trading Account
- Read our latest reviews on: Avatrade, Exness, HFM and XM