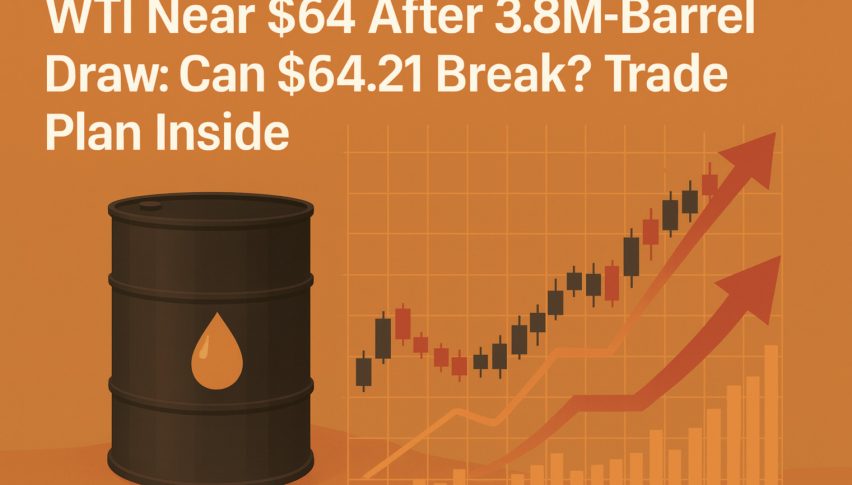
WTI Near $64 After 3.8M-Barrel Draw: Can $64.21 Break? Trade Plan Inside
WTI crude nears $64 after a 3.8M barrel stock draw. See the supply squeeze, geopolitics, and chart levels shaping today’s crude oil...
Quick overview
- WTI crude futures approached $64, buoyed by a significant drop in U.S. crude stocks and tightening supply.
- Export talks from Iraq's Kurdistan have stalled, maintaining a shut pipeline to Turkey since March 2023.
- Geopolitical tensions and limited heavy-crude flows from Venezuela are contributing to market risk premiums.
- Traders are advised to watch for EIA crude stocks data and market reactions to key resistance levels around $64.
WTI crude futures inched toward $64 on Wednesday, extending Tuesday’s +1.8% advance after industry data signaled tightening supply. The API reported a 3.8 million-barrel drop in U.S. crude stocks last week—its largest draw in seven weeks—stoking talk of a thinner cushion heading into autumn refinery runs.
Supply headlines added fuel. Talks to restart exports from Iraq’s Kurdistan stalled as producers sought debt-repayment guarantees, keeping the pipeline to Turkey shut since March 2023.
Geopolitics leaned supportive as well: NATO vowed a “robust” response to airspace incursions, while strikes on Russian energy infrastructure kept risk premia alive. Separately, Chevron will ship only about half of the 240,000 bpd it pumps with partners in Venezuela under July’s U.S. authorization, limiting heavy-crude flows.
What to watch next (today–week)
Policy clarity is scarce, so traders are letting data lead. A broader risk appetite, the dollar’s path, and official U.S. inventory figures will shape the near-term direction. Keep an eye on:
- EIA crude stocks (confirmation or pushback to API draw)
- Headline risk from Kurdistan-Turkey export talks
- Spread behavior in WTI–Brent and crack margins
- U.S. growth prints that move the dollar and yields
Crude Oil (USOIL) Chart levels & trade plan
Technically, WTI is pressing into confluence resistance: a descending trendline, the 200-SMA near $63.77, and horizontal supply at $64.21. Recent candles show upper wicks and small bodies—classic hesitation after a fast rebound.
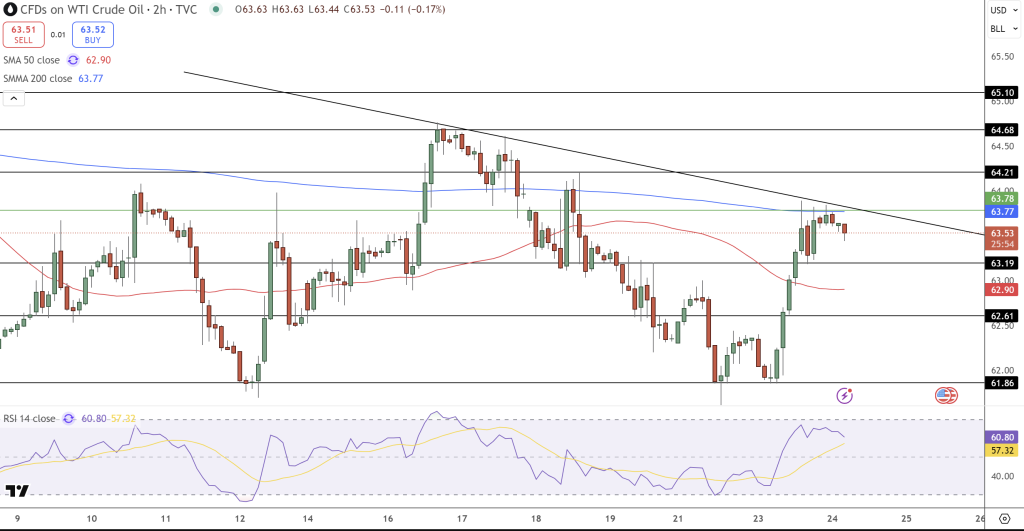
RSI at 61 has cooled from overbought, and price made a marginal higher high while RSI didn’t, hinting at early bearish divergence. The 50-SMA ($62.90) still trails the 200-SMA, keeping the larger bias neutral-to-soft until bulls clear resistance decisively.
From a candlestick lens, spinning tops around $64 telegraph an inflection. Failure to hold above $63.78 could push prices back to $63.19; a break there exposes $62.61 and $61.86. Conversely, a high-conviction close through $64.21 would invalidate the divergence and targets $64.68 then $65.10.
Trade idea:
Consider two conditional setups rather than guessing direction.
- Breakout long: Enter on a close > $64.21; targets $64.68 / $65.10; stop just below $63.78.
- Rejection short: If price closes < $63.19, target $62.61 / $61.86; stop above $64.21.
The logic is simple: let the market confirm. You’re trading reaction at the confluence zone, not a prediction—risk is defined, decisions are rule-based, and the plan adapts to either outcome.
- Check out our free forex signals
- Follow the top economic events on FX Leaders economic calendar
- Trade better, discover more Forex Trading Strategies
- Open a FREE Trading Account
- Read our latest reviews on: Avatrade, Exness, HFM and XM