Gold Price Prediction Today: PCE Data Could Make or Break $3,730 Support
Gold edged lower on Friday, trading near $3,746 as stronger than expected US data boosted the dollar and tempered expectations...

Quick overview
- Gold prices fell to around $3,746 as stronger US economic data strengthened the dollar, making gold more expensive for international buyers.
- Analysts suggest that the dollar's strength is a barrier to gold reaching $3,800, while new tariffs from President Trump may increase safe haven demand for gold.
- Investors are awaiting the release of the PCE index, which is expected to show a rise in inflation, influencing future Fed rate decisions.
- Technically, gold is consolidating above key support levels, with traders looking for confirmation of bullish or bearish signals.
Gold edged lower on Friday, trading near $3,746 as stronger than expected US data boosted the dollar and tempered expectations of more Fed easing. The US dollar index is at a 3 week high making dollar priced gold more expensive for overseas buyers.
Tim Waterer, chief market analyst at KCM Trade said “the dollar is back in form and is the obstacle between gold and $3,800”. He added that President Trump’s new tariffs announced yesterday will provide a cushion for gold by increasing safe haven demand.
Fresh data showed US jobless claims down and 2nd quarter GDP revised higher on strong consumer spending and business investment. Now investors are waiting for Friday’s release of the Fed’s preferred inflation measure – the PCE index – which is forecast to rise 0.3% month on month and 2.7% year on year in August.
Fed Signals and Inflation Watch
Fed policymaker Stephen Miran said rate cuts are needed to protect the labour market. While tariffs may increase inflation risks, lower interest rates make gold more attractive as a non yielding safe haven.
Market participants are cautious ahead of the PCE release as they weigh whether inflation will follow the upside surprise in GDP. Until then gold is expected to be range bound with sentiment split between dollar momentum and dovish Fed comments.
Gold (XAU/USD) Technical Setup for Traders
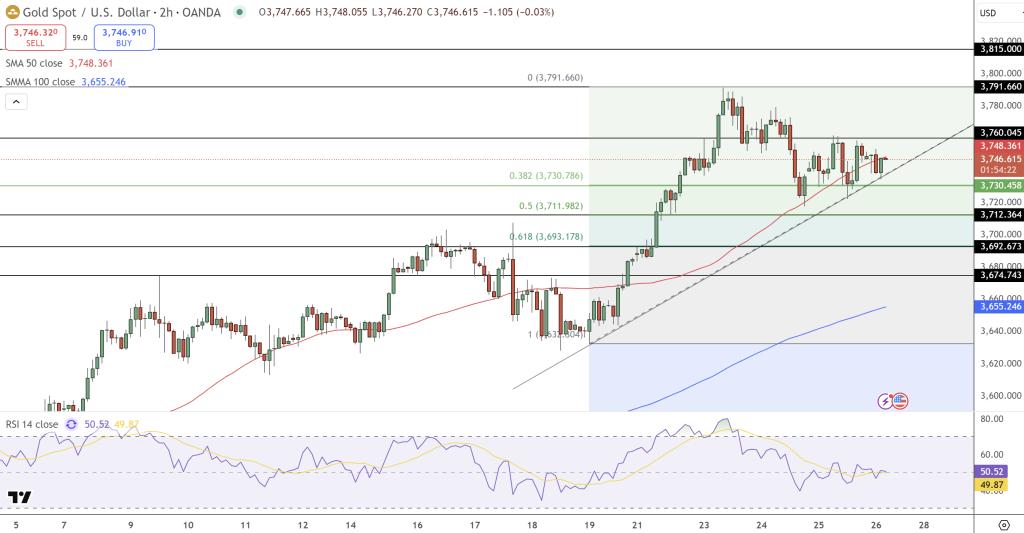
From a technical perspective gold is consolidating just above the ascending trendline support. The 50 period SMA at $3,748 is the immediate support, with Fibonacci levels at $3,730 (38.2%) and $3,712 (50%) as key short term pivots.
Candlestick formations – spinning tops near $3,760 – indicate indecision and the RSI is at 50 reinforcing a neutral view. Traders should look for confirmation candles:
- A bullish engulfing candle near $3,730-$3,712 could validate buyer defence and set up a move to $3,760 and $3,790.
- A break below $3,712 risks further downside to $3,692 and $3,674.Buy near $3,730 with stop $3,692.
- Check out our free forex signals
- Follow the top economic events on FX Leaders economic calendar
- Trade better, discover more Forex Trading Strategies
- Open a FREE Trading Account
- Read our latest reviews on: Avatrade, Exness, HFM and XM
Related Articles