GBP/USD Price Forecast: Pound Struggles at $1.34 as Fed Cuts Loom
The Pound edged higher on Monday, trading near $1.3435 as the US Dollar softened after the latest inflation report...
Quick overview
- The Pound rose to around $1.3435 as the US Dollar weakened following a higher-than-expected inflation report.
- Traders anticipate an 88% chance of a rate cut by the Federal Reserve in October, contrasting with the Bank of England's steady rate outlook.
- GBP/USD is at a critical resistance level near $1.3434, with potential bullish and bearish scenarios depending on price action.
- Investors are cautious ahead of speeches from key Fed officials that could influence market sentiment.
The Pound edged higher on Monday, trading near $1.3435 as the US Dollar softened after the latest inflation report. The Personal Consumption Expenditures (PCE) Price Index rose 2.7% year-on-year in August, slightly above July’s 2.6%, while core PCE held steady at 2.9%.
Markets saw this as a sign that inflation is contained and there’s room for more Fed easing. According to the CME FedWatch Tool, traders now see an 88% chance of a rate cut in October and 65% in December, following September’s 25-basis-point cut. This dovishness has capped the Dollar’s upside and supported GBP/USD’s short-term bounce.
BoE Stability Adds Support for Sterling
Unlike the Fed, the Bank of England (BoE) has no urgency to ease. With UK inflation above target, the BoE is expected to hold rates at 4.0% through 2024, so steady support for the pound.
This divergence between Fed dovishness and BoE caution has widened, so Sterling is winning recently. But investors are cautious ahead of speeches from key Fed officials later Monday, including Christopher Waller and John Williams, which could shift sentiment if they sound more hawkish.
GBP/USD Technical Outlook: Make-or-Break Zone
GBP/USD is trading near $1.3434, against a descending trendline and the 50-SMA ($1.3435) — a resistance cluster that’s been capping gains since mid-September.
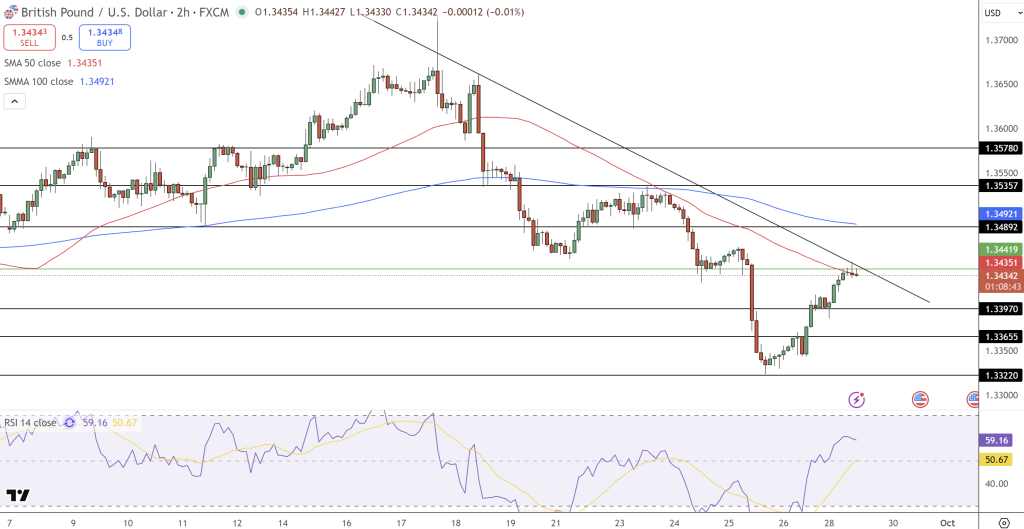
Recent price action shows:
- Three white soldiers pattern looking bullish.
- A long upper wick on the latest candle, so sellers are still active.
- RSI at 59, recovering but not overbought, so room for more upside.
Scenarios to watch:
- Bullish: Above $1.3467 and $1.3490–$1.3535, where the 100-SMA and prior highs are.
- Bearish: Rejection here and $1.3397, with deeper risk to $1.3365 if sellers take control.
- Trade: Long above $1.3467, $1.3535, stop $1.3390. Or short on rejection.
- Check out our free forex signals
- Follow the top economic events on FX Leaders economic calendar
- Trade better, discover more Forex Trading Strategies
- Open a FREE Trading Account
- Read our latest reviews on: Avatrade, Exness, HFM and XM
Related Articles

Sidebar rates
Related Posts
