WTI Oil Holds $62 as OPEC+ Supply Debate and Chart Levels Steer Outlook
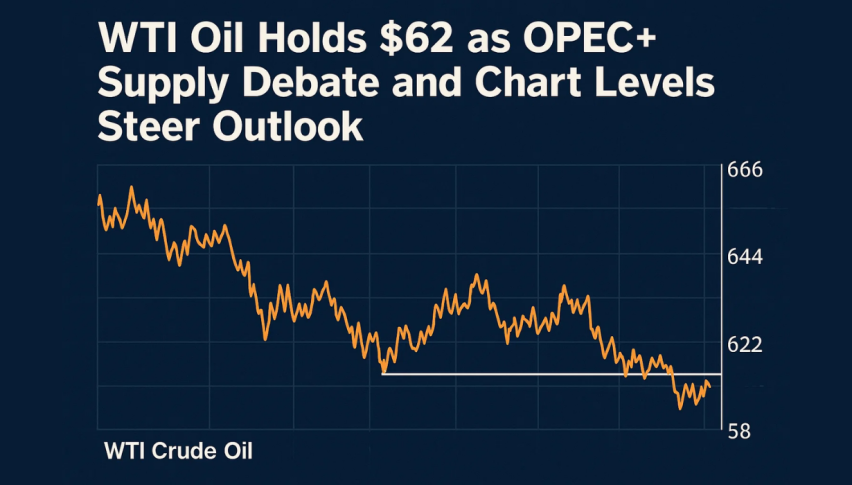
WTI crude oil futures held near $62.50 on Wednesday after a two-day sell-off, as traders weighed fresh supply signals from OPEC+...
Quick overview
- WTI crude oil futures are stabilizing around $62.50 after a recent sell-off, influenced by OPEC+ supply signals and declining U.S. crude inventories.
- The American Petroleum Institute reported a 3.7 million-barrel drop in U.S. crude stocks, which alleviated some selling pressure.
- OPEC+ is considering a production increase, but geopolitical risks and domestic uncertainties in the U.S. continue to impact demand.
- Technically, crude is consolidating near key support levels, with traders watching for a decisive move above $63.50 or below $61.62.
WTI crude oil futures held near $62.50 on Wednesday after a two-day sell-off, as traders weighed fresh supply signals from OPEC+ against lower U.S. crude inventories.
The American Petroleum Institute (API) reported a 3.7 million-barrel decline in U.S. crude stocks last week, which eased some of the selling pressure. At the same time, reports said eight OPEC+ members are considering a 274,000-411,000 bpd production increase in November, but the group denied a 500,000 bpd hike.
Geopolitical risks and U.S. domestic uncertainty are still in play. Government shutdown concerns are reducing demand and Middle East tensions remain unresolved.
WTI Crude Oil Technical Picture at $62 Support
From a technical perspective, crude is consolidating near a rising trendline that has supported price since late September. Support is firm at $62.20-$62.00, with deeper floors at $61.62 and $61.03 if momentum weakens.
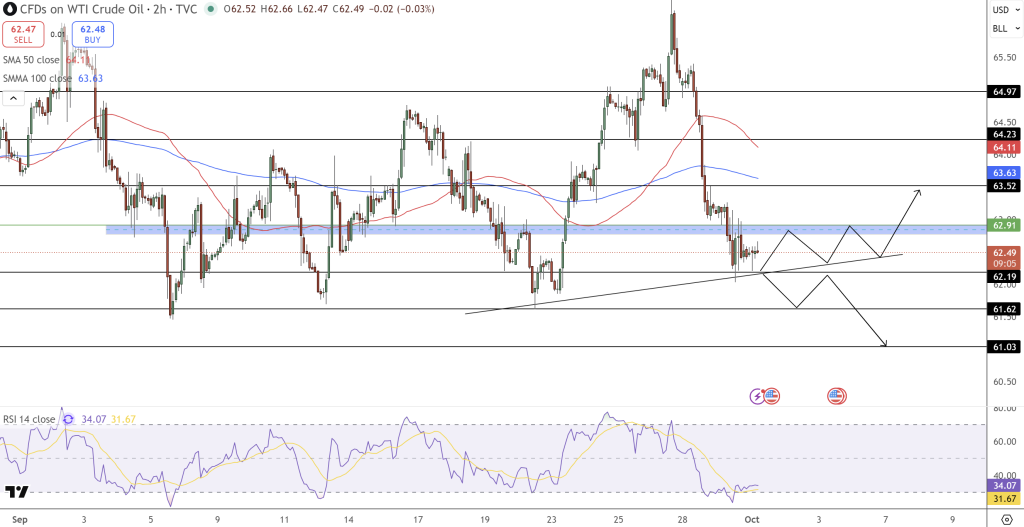
Recent candles have printed spinning tops near $62.90, a sign of indecision after recent volatility. The RSI is 34, which is oversold territory, and suggests selling is fading. Above, the 50-SMA ($64.11) and 100-SMA ($63.63) form a strong resistance zone, so $63.50-$64.20 is the key zone for traders.
Trade Setup and Market Outlook
For traders, it’s a toss-up:
- Bullish case: Close above $63.50, preferably on a bullish engulfing candle, and we could see $64.97.
- Bearish case: Fail to hold support or a shooting star and we could see $61.62-$61.03.
In short, crude is at a crossroads. With OPEC+ and U.S. economic risks in play, the next move—up or down—will set the tone for October.
- Check out our free forex signals
- Follow the top economic events on FX Leaders economic calendar
- Trade better, discover more Forex Trading Strategies
- Open a FREE Trading Account
- Read our latest reviews on: Avatrade, Exness, HFM and XM
Related Articles


Sidebar rates
Related Posts
