Dogecoin Consolidates Above $0.25 as Multiple Analysts Signal Breakout Toward $0.30
At the time of writing, Dogecoin (DOGE) is trading at $0.2540, down 3.8% in the last 24 hours. However, it is still holding key support
Quick overview
- Dogecoin is currently trading at $0.2540, down 3.8% in the last 24 hours, but analysts remain optimistic about its short-term future.
- Technical patterns suggest a potential rise towards the $0.30 level, with an ascending channel indicating bullish momentum.
- A nine-month ascending triangle is forming, with a breakout above $0.30 potentially leading to prices reaching $0.38 to $0.40.
- Increased trading volume and on-chain activity support the bullish outlook, with analysts predicting a short-term advance if key support levels hold.
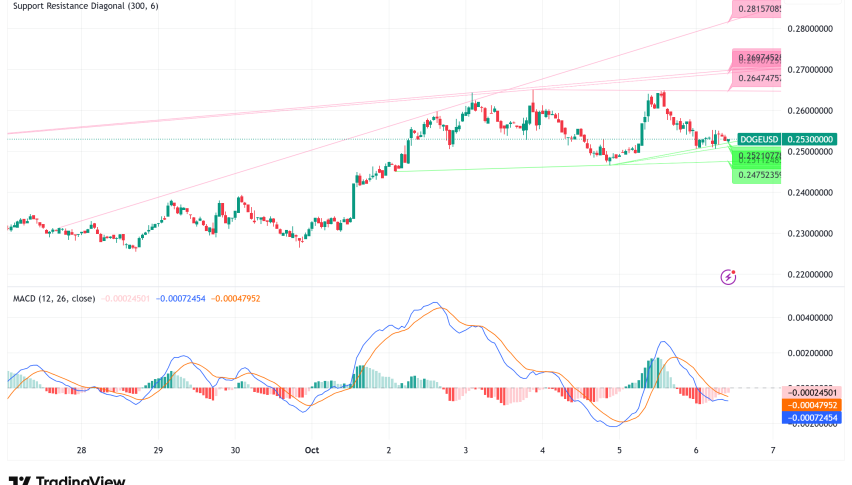
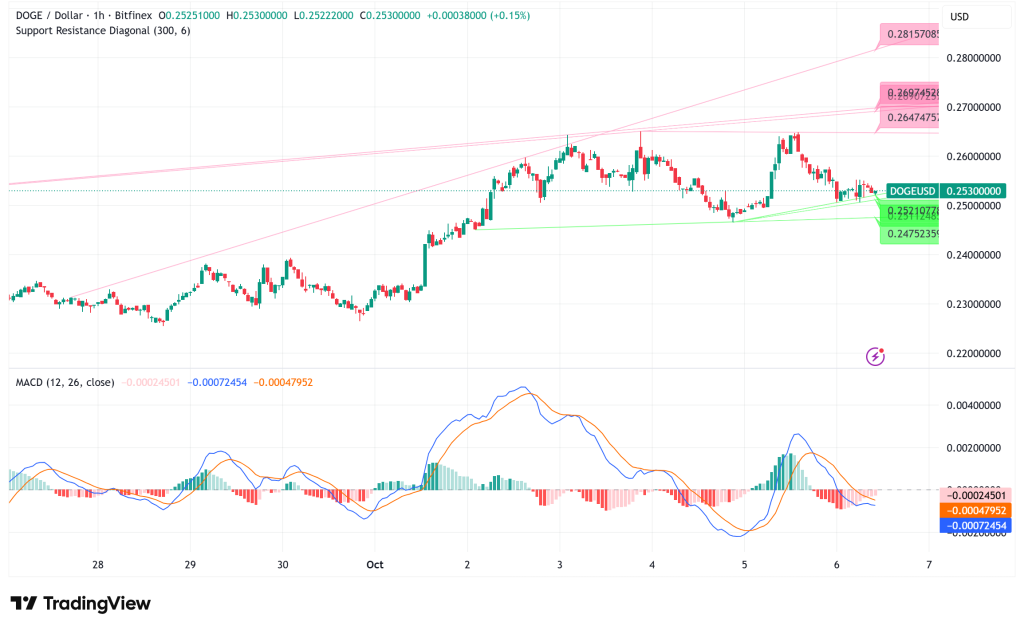
At the time of writing, Dogecoin DOGE/USD is trading at $0.2540, down 3.8% in the last 24 hours. However, it is still holding important support levels, which makes analysts more and more optimistic about the meme cryptocurrency’s short-term future. Even though prices have dropped from weekend highs of $0.26, several technical patterns are coming together to suggest that prices could rise approaching the important $0.30 level.
DOGE/USD Technical Patterns Align for Bullish Continuation
Several well-known crypto experts have found strong chart patterns that suggest a rise up is about to happen. Ali Martinez, a crypto analyst, says that Dogecoin is now trading in an ascending channel, which is a pattern that usually means the price will keep going up. Martinez says that DOGE is still in an accumulation period and needs to break over $0.30 cleanly to move into an expansion phase that might lead to even higher prices.
The $0.30 level is both a psychological and technical barrier that has stopped DOGE from going up in recent months. This resistance zone, which is between $0.28 and $0.30, has been tried many times since early 2025. It has made a horizontal ceiling that has made bulls angry.
Analyst Trader Tardigrade has found a classic cup and handle pattern on the 4-hour chart. The rounded bottom formed in late September and early October, which kept DOGE stable around $0.23 before it rose to $0.26. The consolidation of the handle between $0.24 and $0.25 has now been absorbed, and the breakthrough that followed has given the bulls new strength. When validated with volume, this pattern has historically come before big rallies.
Nine-Month Ascending Triangle Approaches Critical Apex
The nine-month ascending triangle that has been forming since early 2025 is perhaps the most important thing to look for, according to TradingView analysis. This consolidation pattern has support that rises at $0.22 and resistance that stays the same between $0.28 and $0.30. This makes the range tighter, which usually happens before big moves.
If Dogecoin breaks out above $0.30, it might go up to $0.38 to $0.40, which is the top of the triangle formation and the same level as previous resistance zones from earlier this year. Technical analysts, on the other hand, say that a breakthrough like this needs to be backed up by a strong daily candle close over $0.30 and a volume spike of two to three times usual levels in order to be real.
Analyst EtherNasyonaL adopts an even more aggressive attitude, saying that DOGE has passed a successful retest after breaking above a downward trendline of lower highs. The most recent 3-day candlestick indicates a bullish candle emerging over $0.25. EtherNasyonaL thinks this might lead to a surge that breaks the previous peak above $0.755 and sets new all-time highs.
Dogecoin’s Long-Term Momentum Indicators Flash Bullish Signals
DOGE has had a bullish MACD crossover on the monthly time frame. This is a long-term momentum indicator that has come before big price rises. Trader Tardigrade pointed out that a similar crossover in early 2024 caused prices to rise a lot. If momentum stays strong, estimates based on this technical structure put the cryptocurrency in the $0.50 to $0.60 band over the next few months. This is because the same signal appeared again in late 2025 and DOGE has been making higher lows since the bottom in 2022.
TradingView’s Moving Average Convergence Divergence indicator currently shows a “Buy” signal for DOGE. However, the Bull Bear Power indicator remains “Neutral,” which means that while momentum is building, the fight between buyers and sellers has not yet clearly tipped in favor of bulls.
Volume Surge and On-Chain Activity Support Rally Thesis
For any bullish scenario to work, there needs to be enough trade volume. Recent data shows that this is happening. In the last 24 hours, Dogecoin’s trading volume jumped by 60%, surpassing $2.5 billion across all exchanges. Also, the number of active addresses and the number of transactions have both gone up in the last few trading hours, which shows that the network is getting busier and more investors are interested.
This rise in volume happened at the same time as Bitcoin’s rise above $125,000, showing that capital often moves into high-liquidity altcoins like DOGE as Bitcoin rises. The coin’s significant cultural influence and constant talks about payment integrations keep people interested in buying it.
Dogecoin Price Prediction: Path to $0.30 and Beyond
Analysts agree that, based on present technical settings, there will be a short-term advance toward $0.30, with higher goals if that level is broken convincingly. There is immediate resistance at about $0.2587, and the next big barrier is the important $0.30 level.
If it doesn’t stay above the $0.22 to $0.24 support zone, the bullish setup will be incorrect, and it could go down again. But if it stays at its current levels and breaks past $0.30 with a lot of volume, it might go up to $0.38-$0.40 in the immediate future, with channel resistance going up to $1.25 in the long term.
- Check out our free forex signals
- Follow the top economic events on FX Leaders economic calendar
- Trade better, discover more Forex Trading Strategies
- Open a FREE Trading Account
- Read our latest reviews on: Avatrade, Exness, HFM and XM
Related Articles

Sidebar rates
Related Posts
