Gold Weekly Forecast: CPI, PMI, and Housing Data Could Test the $4,200 Support
Gold Weekly Forecast: Key CPI, PMI, and housing data this week could test $4,200 support as traders weigh inflation risks and Fed policy out

Quick overview
Gold (XAU/USD) enters the week holding steady near $4,250, recovering slightly after last week’s sharp drop from the $4,381 high. The metal’s near-term outlook hinges on a packed U.S. data calendar that could define whether the recent pullback is merely a pause—or the start of a deeper correction.
Markets are bracing for key inflation and business activity indicators that may reset expectations for Federal Reserve rate cuts. The spotlight will be on Friday’s CPI and PMI releases, which tend to heavily influence Treasury yields and the U.S. dollar—two critical drivers of gold’s direction.
Key Economic Events to Watch
-
Existing Home Sales (Thu, Oct 23): Forecast at 4.06M, slightly above the previous 4.00M, signaling tentative stability in the housing sector.
-
Core CPI m/m (Fri, Oct 24): Forecast 0.3%, unchanged from the prior month. A surprise uptick could strengthen the dollar and weigh on gold.
-
CPI y/y: Expected at 2.9%, steady from the previous reading. Inflation holding below 3% would support the case for gradual Fed easing in Q4.
-
Flash Manufacturing PMI: Forecast 51.9 vs. 52.0 prior, implying marginal cooling but continued expansion.
-
Flash Services PMI: Forecast 53.5, down from 54.2, suggesting softer consumer activity.
-
Revised Michigan Consumer Sentiment: Forecast 55.0, unchanged, indicating continued consumer caution.
-
New Home Sales (Tentative): Projected around 800K, reflecting stable but subdued housing demand.
Overall, stable inflation and a mild economic slowdown could keep rate-cut expectations intact, providing near-term support for gold.
Technical Outlook: Gold Eyes Channel Support
On the 2-hour chart, gold trades within a rising channel, with support near the 61.8% Fibonacci level at $4,200 and resistance around $4,324–$4,381. The 50-EMA and Fibonacci confluence at $4,200 remain critical for maintaining bullish structure.
Recent price action shows a spinning top candle near $4,212, reflecting indecision after a substantial decline, while the RSI has recovered from 48, hinting at potential momentum rebuilding. The series of higher lows since October 10 suggests that buyers are still defending the broader uptrend.
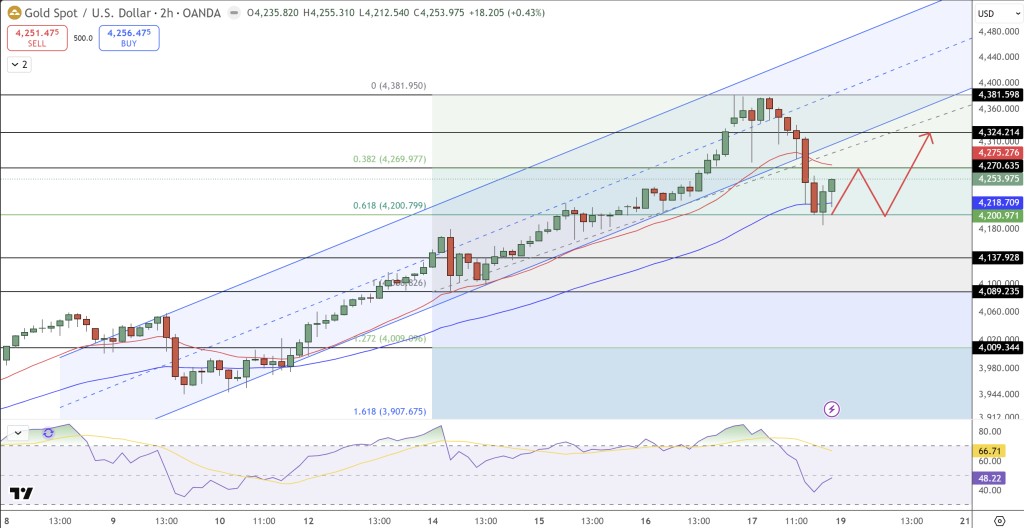
Trade Setup:
-
Buy Zone: $4,220–$4,230
-
Stop-Loss: Below $4,180
-
Targets: $4,324 and $4,381
-
Bias: Bullish above $4,200, bearish below it
If gold sustains above $4,200, traders may see another leg higher toward $4,380, especially if U.S. CPI data confirms cooling inflation. However, a break below support could trigger a correction toward $4,137 or even $4,089.
Bottom Line
Gold’s next move depends on whether U.S. data reinforces or challenges the soft-landing narrative. A benign inflation print could keep Fed easing hopes alive and drive another rally toward $4,380. But if inflation surprises to the upside, expect renewed pressure on gold as yields rebound.
In short, the $4,200 support zone will be the battleground for bulls and bears this week—and Friday’s CPI report could decide which side wins.
- Check out our free forex signals
- Follow the top economic events on FX Leaders economic calendar
- Trade better, discover more Forex Trading Strategies
- Open a FREE Trading Account
- Read our latest reviews on: Avatrade, Exness, HFM and XM
Related Articles


Sidebar rates
Related Posts
