Gold Plunges 8% From Record High—Is the $4,000 Floor Strong Enough to Hold?
Gold prices have taken a 8% tumble from last weeks record high of $4,375 , briefly dipping as low as $4,004 before taking a steady...

Quick overview
- Gold prices have dropped 8% from last week's high of $4,375, briefly hitting $4,004 before recovering to around $4,131.
- The decline is attributed to profit-taking and easing U.S.–China trade tensions, with President Trump optimistic about a deal with Xi Jinping.
- After a 56% surge this year, investors are awaiting the U.S. Consumer Price Index report for insights on potential Federal Reserve rate cuts.
- Technical analysis indicates a bearish trend for gold, with key support at $4,000 and potential targets for rebounds or further corrections.
Gold prices have taken a 8% tumble from last weeks record high of $4,375 , briefly dipping as low as $4,004 before taking a steady climb back up to around $4,131 on Wednesday . This retreat is likely a case of taking a step back to profit take after a long run up and a shift in sentiment now that we’re seeing signs of U.S.–China trade tensions easing off.
President Donald Trump is expecting to come to some sort of “fair” deal with Xi Jinping of China when they meet up next week in South Korea – and he’s also trying to downplay concerns about Taiwan. Meanwhile the US & India are pretty close to finalising a long-stalled trade deal that would cut tariffs on Indian imports down to around 15-16% – down from the current 50% according to some reports in mint.
After surging about 56% this year, gold is now consolidating as investors await the U.S. Consumer Price Index (CPI) report on Friday for clues on the Federal Reserve’s next rate move. A Reuters poll of economists anticipates two more rate cuts this year, one next week and another in December, but analysts remain split on the Fed’s path in 2026.
Gold (XAU/USD) Technical Picture Turns Bearish
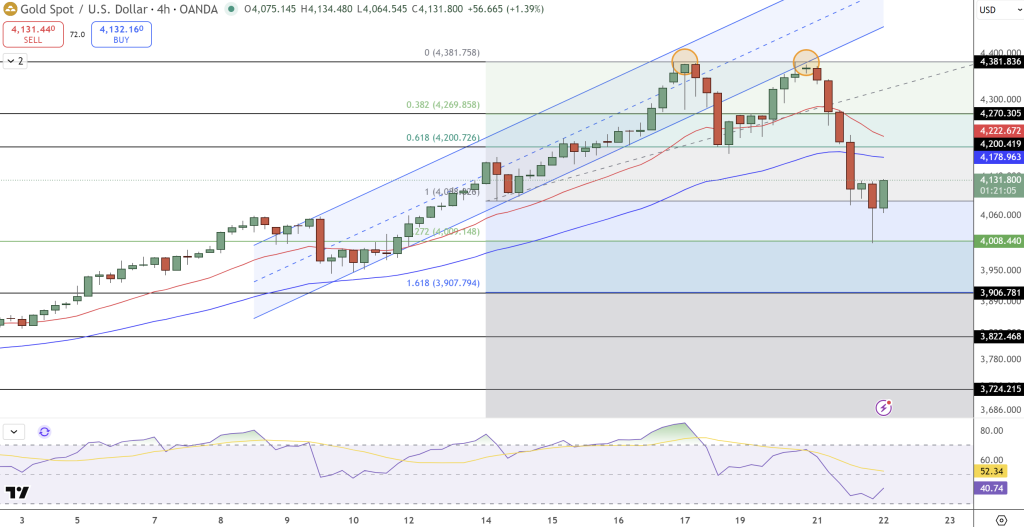
On the 4 hour chart, gold has been forming a double top at $4,381 – kind of the final exhalation of steam after its wild ride upwards – the break out of its ascending channel and a drop below the 20-ema and 50-ema means we’ve got a short term bearish crossover on our hands.
Earlier this week, a three black crows formation highlighted strong selling momentum, while the RSI, now around 40, reflects weakening strength. Still, the long lower wick on the latest candle suggests buyers are defending the $4,008–$4,000 zone, a key area aligned with the 1.0 Fibonacci retracement and prior consolidation support.
Gold (XAU/USD) Key Levels to Watch
If gold holds above $4,000 and prints a bullish engulfing or three white soldiers pattern, a rebound toward $4,200 and $4,270 could follow. A decisive break below $4,000, however, may trigger a deeper correction toward $3,907 and $3,822.
Trade Setup:
- Entry: Long above $4,010
- Stop Loss: $3,985
- Targets: $4,200–$4,270
- Alternative: Short below $4,000 toward $3,907
For now, the market remains in a technical correction, with traders watching the $4,000 support as the line between a temporary pullback and a deeper retracement.
- Check out our free forex signals
- Follow the top economic events on FX Leaders economic calendar
- Trade better, discover more Forex Trading Strategies
- Open a FREE Trading Account
- Read our latest reviews on: Avatrade, Exness, HFM and XM
Related Articles


Sidebar rates
Related Posts
