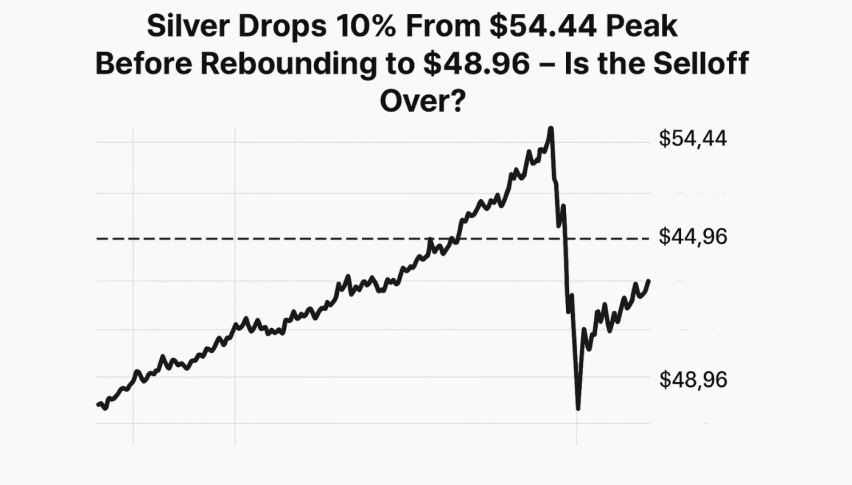
Silver Drops 10% From $54.44 Peak Before Rebounding to $48.96 – Is the Selloff Over?
Silver (XAG/USD) has taken a pretty sharp 10% tumble from the highs round $54.44, and prices are holding steady around $48.96...
Quick overview
- Silver (XAG/USD) has dropped 10% from its recent high of $54.44, stabilizing around $48.96 amid a market correction.
- The decline in silver prices coincides with optimism in U.S.-China trade talks and easing recession fears due to potential Fed interest rate cuts.
- Despite the recent downturn, silver is up over 40% for the year, driven by central bank buying and industrial demand.
- Key price levels to watch include support at $47.50 and resistance at $49.50, which could indicate a shift in market momentum.
Silver (XAG/USD) has taken a pretty sharp 10% tumble from the highs round $54.44, and prices are holding steady around $48.96 after a pretty dramatic correction that’s lasted all week. Its decline has come hand in hand with Gold, as the optimism surrounding U.S.-China trade talks and general profit-taking started to chip away at the allure of safe havens.
The whole markets mood has brightened up a bit, after we got some decent signals that a fair trade deal between Trump and Xi Jinping is actually happening. Meanwhile India and the US are making progress towards a tariff agreement that would shave import duties to a relatively modest 15-16%. On top of that there are expectations that the Fed is looking to cut interest rates, which has really eased recession fears and put the brakes on demand for precious metals.
Even so silver is still one of the standout performers for 2025 so far, up over 40% for the year, with a bit of help from sustained buying by central banks, plus a healthy dose of industrial demand from sectors like solar energy and EVs.
Technical Setup: Correction or Trend Shift?
Technically, silver’s decline marks a break below its ascending channel, confirming a shift from bullish to corrective mode. The price is trading below both the 20-EMA and 50-EMA, which have formed a bearish crossover, signaling continued downside risk.
The Relative Strength Index (RSI) recently bounced from 36, showing mild recovery from oversold conditions but not yet confirming a full reversal. The latest long lower wick candle near $47.50 suggests buyers are defending key support, often a precursor to short-term stabilization.
Earlier, a three black crows pattern signaled bearish strength, but a developing bullish engulfing candle above $49.50 could mark the start of a recovery.
Silver Key Levels to Watch
If buyers manage to hold above $49.50, silver could retest $50.83 and $52.75, where the EMAs and prior channel base align. A decisive break above these levels would indicate a return to bullish momentum.
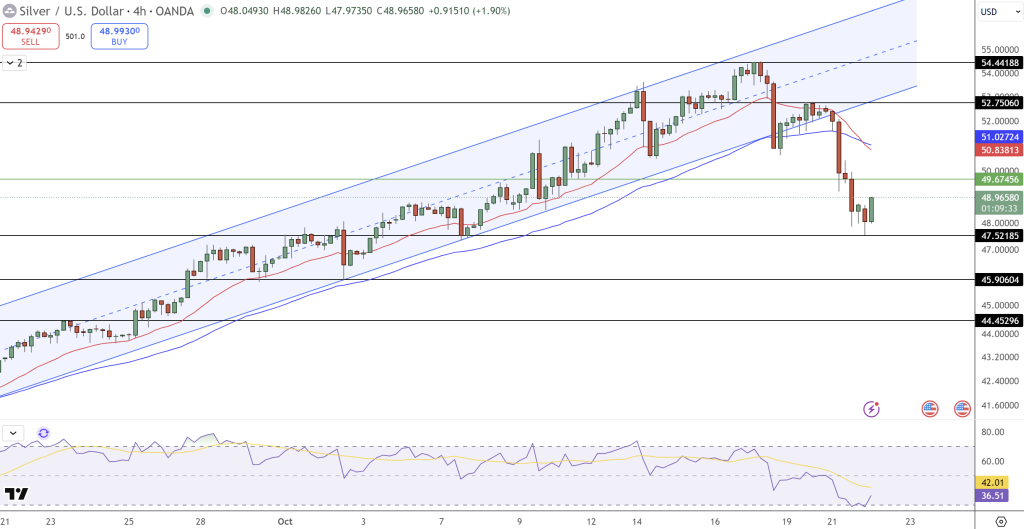
However, a drop below $47.50 could extend losses toward $45.90 and $44.45, aligning with the 0.786 Fibonacci retracement of the previous rally.
Trade Setup:
- Buy Zone: $48.80–$49.00 (confirmation above $49.50)
- Targets: $50.80 and $52.75
- Stop Loss: Below $47.40
Silver Outlook: Buyers Testing the Waters
Silver’s near-term trend remains fragile, but strong buying activity around $47.50 hints that the market may be forming a temporary base. A rebound above the EMAs could restore confidence, while the $47.50 support remains the line separating a routine correction from a deeper selloff.
- Check out our free forex signals
- Follow the top economic events on FX Leaders economic calendar
- Trade better, discover more Forex Trading Strategies
- Open a FREE Trading Account
- Read our latest reviews on: Avatrade, Exness, HFM and XM
Related Articles
Sidebar rates
Related Posts
