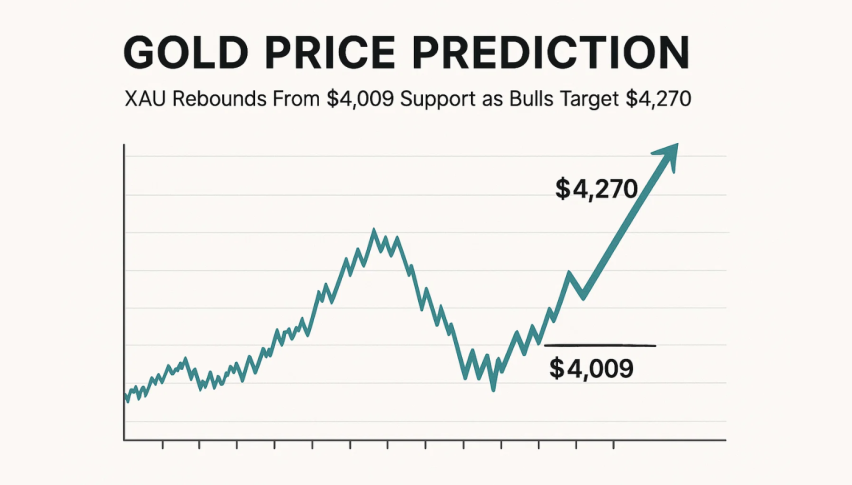
Gold Price Prediction: XAU Rebounds From $4,009 Support as Bulls Target $4,270
Gold (XAU/USD) is currently stuck at around $4,116 after making a pretty sharp reversal from a record price of $4,383.
Quick overview
- Gold (XAU/USD) is currently stable around $4,116 after a sharp reversal from its record high of $4,383, influenced by easing US-China trade tensions and profit-taking.
- Silver (XAG/USD) is performing well, up 0.34% to $48.66, driven by industrial demand and expectations of a Federal Reserve interest rate cut.
- Technical analysis shows gold has found support at $4,009, with a bullish engulfing pattern indicating potential accumulation, though it remains below key moving averages.
- The medium-term outlook for gold appears bullish due to geopolitical uncertainty and the potential for a Federal Reserve rate cut, despite short-term volatility influenced by upcoming inflation data.
Gold (XAU/USD) is currently stuck at around $4,116 after making a pretty sharp reversal from a record price of $4,383. And now its holding steady, as seems to be the case whenever there’s a little easing of US-China trade tensions & some profit-taking happens on the safe-haven demand front. Also worth noting , traders were trimming their positions ahead of that US inflation data which is due Friday – & in India meanwhile , the usual post-Diwali dip in demand has pretty much limited any upside potential for the metal.
Silver (XAG/USD), on the other hand, is looking relatively strong – up 0.34% to $48.66, thanks to industrial demand & some expectations of a Federal Reserve interest rate cut later in the year.
Gold (XAU/USD) Technical Outlook: The Levels to Watch
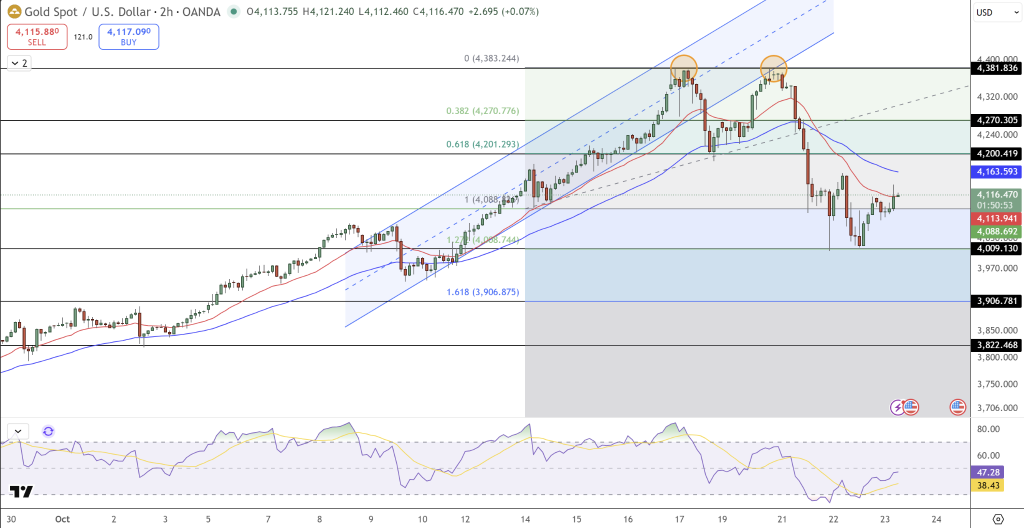
When you take a look at the 2-hour chart, you can see that gold found a pretty nice level of support at $4,009 – this just happens to be the 0.786 Fibonacci retracement & the lower boundary of its ascending channel – a pretty key demand zone, if you ask me, that’s signaling potential accumulation.
The recent candles on the chart have actually formed a pretty typical bullish engulfing pattern – which might just indicate the buyers are starting to get back in control. The RSI is also recovering from being in the oversold zone & is now up around 47 – that suggests to me that the bearish momentum is starting to fade. However, gold is still below both the 20-EMA & 50-EMA, so we still need to see a bit more confirmation before we can be sure about a sustained rebound.
So lets take a look at what would need to happen next. A close above $4,163 would be a pretty good sign that the metal is regaining its strength & that would open the way for $4,200 & $4,270. But if it breaks below $4,088, it could well extend its losses all the way down to $3,906 – where hopefully prior demand will come back in & attract some more buyers.
Broad Market Drivers: Inflation, Shutdown and Fed Cuts
While things look a bit uncertain in the short-term, the medium-term picture for gold is actually pretty bullish. With the ongoing US government shutdown, the Fed’s pretty high confidence in a rate cut, & all the ongoing geopolitical uncertainty, we can see why gold is actually a good bet.
Now if the upcoming CPI data comes in higher than expected, that could give the dollar a bit of a boost & put some pressure on gold. But at the same time, if that happens, you can still see it as a buying opportunity – especially if you’re looking to hedge against inflation & policy uncertainty.
Gold (XAU/USD) Trade Setup
- Buy Zone: $4,100-$4,120 (only with a close above $4,163)
- Targets: $4,200 & $4,270
- Stop Loss: below $4,080
For new traders and especially those who are still learning the ropes – a bullish engulfing or three white soldiers pattern above $4,160 could well confirm a fresh upward move – that would be a pretty good sign that gold’s about to enter its next recovery phase.
- Check out our free forex signals
- Follow the top economic events on FX Leaders economic calendar
- Trade better, discover more Forex Trading Strategies
- Open a FREE Trading Account
- Read our latest reviews on: Avatrade, Exness, HFM and XM