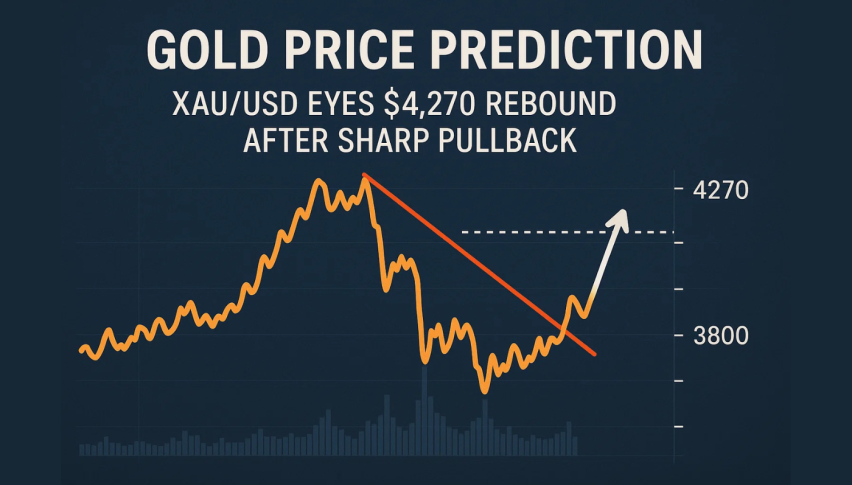
Gold Price Prediction: XAU/USD Eyes $4,270 Rebound After Sharp Pullback
Gold (XAU/USD) is holding steady around $4,115 following its retreat off the record high $4,383 amid the traders reassessing positions...
Quick overview
- Gold (XAU/USD) is currently stable around $4,115 after retreating from a record high of $4,383, indicating a reassessment of trader positions.
- The price is consolidating within a downward channel, suggesting a cooling sentiment but also a potential end to the correction phase.
- Key resistance levels to watch are $4,150, $4,200, and $4,270, while support is found at $4,089 and $3,906.
- Traders are advised to wait for a breakout confirmation above $4,150 before entering new positions.
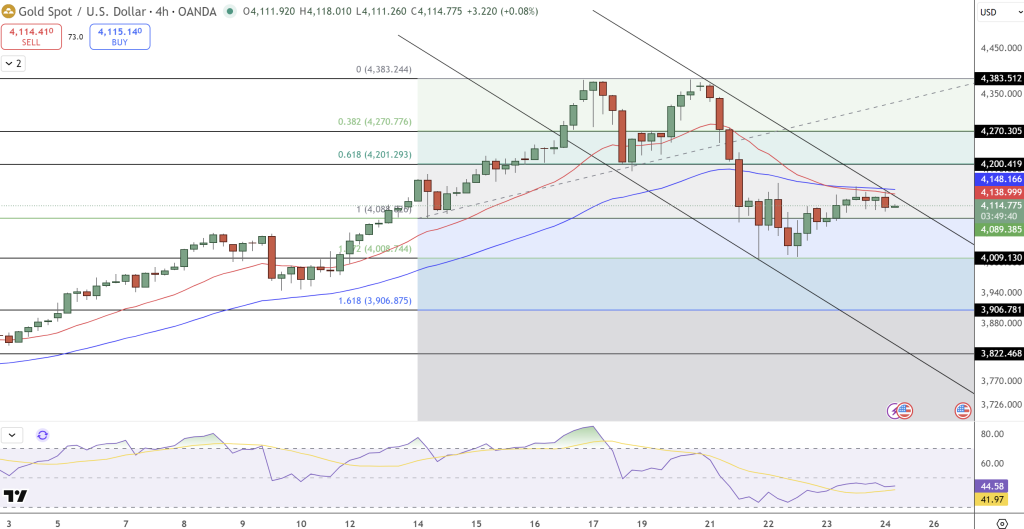
Gold (XAU/USD) is holding steady around $4,115 following its retreat off the record high $4,383 amid the traders reassessing positions in the break in momentum. The 4-hour chart of the metal depicts that the price has been consolidating within a downward channel which indicates a cooling of sentiment, however, also indicates that the correction stage may be wearing out.
The presence of small bodies, with prolonged lower wicks around the support zone of $4,009 shows that buyers are shyly reentering the market. This mark coincides with the 0.786 Fibonacci retracement that signifies a possible area of demand in which Veralan dip-buying may also resurface.
Gold (XAU/USD Technicals Support a Major Resistance Area
The short-term gold price is now between the 4,140 and 4,150 mark, the 20-EMA and the 50-EMA are at the same point, and it will need to break the powerful ceiling before it can certify a reversal in the trend. A strong close above this level would lead to a potential bullish EMA crossover, which would provide entry into the 4200 and 4270 levels, which are the 0.618 and 0.382 Fibonacci levels.
The RSI at 44 is neutral yet it has lifted off the oversold ground and is experiencing positive momentum. Nevertheless, in the absence of a breakout, gold can be exposed to further consolidation or a temporary backlash.
Gold (XAU/USD Key Levels to Watch
- Resistance: $4,150, $4,200, $4,270
- Support: $4,089, $3,906
- EMA Signal: Wait on crossover validation above $4,150.
Gold (XAU/USD) Trade Analysis: Awaiting Confirmation
Patience is the best way to go with new traders. The expected strength and a possible breakout of the channel would be affirmed by a bullish engulfing candle or a three white soldiers above the price of 4,150.
- Buy Zone: Over $4,150 (on break out confirmation)
- Targets: $4,200 and $4,270
- Stop Loss: Below $4,085
Until such an affirmation is received, the sideways trend of the gold is an indication of a balance between buyers and sellers- a still before the next directional trend.
- Check out our free forex signals
- Follow the top economic events on FX Leaders economic calendar
- Trade better, discover more Forex Trading Strategies
- Open a FREE Trading Account
- Read our latest reviews on: Avatrade, Exness, HFM and XM
Related Articles


Sidebar rates
Related Posts
