Ethereum Bulls Battle Crucial $4,200 Resistance for Next Major Breakout Opportunity
Ethereum (ETH) is trading at about $4,000, down 2.8% in the last 24 hours. This is because the second-largest cryptocurrency is taking a
Quick overview
- Ethereum is currently trading around $4,000, down 2.8% in the last 24 hours after reaching a local high of $4,252.
- Technical analysts remain optimistic, predicting potential price targets for Ethereum ranging from $5,600 to $16,000 based on Elliott Wave theory.
- The $4,200 resistance level is crucial for Ethereum's near-term price action, with a breakout potentially leading to bullish momentum.
- Institutional interest is growing, with Standard Chartered Bank raising its 2025 price prediction for Ethereum to $7,500, bolstering long-term bullish sentiment.
Ethereum ETH/USD is trading at about $4,000, down 2.8% in the last 24 hours. This is because the second-largest cryptocurrency is taking a break after rising above $4,250. Even though the market has pulled back, most technical analysts are still very enthusiastic. They think prices will reach anywhere from $5,600 in the near future to an ambitious $16,000 based on Elliott Wave theory.
ETH/USD Near-Term Technical Setup: Bulls Defend Key Support Zones
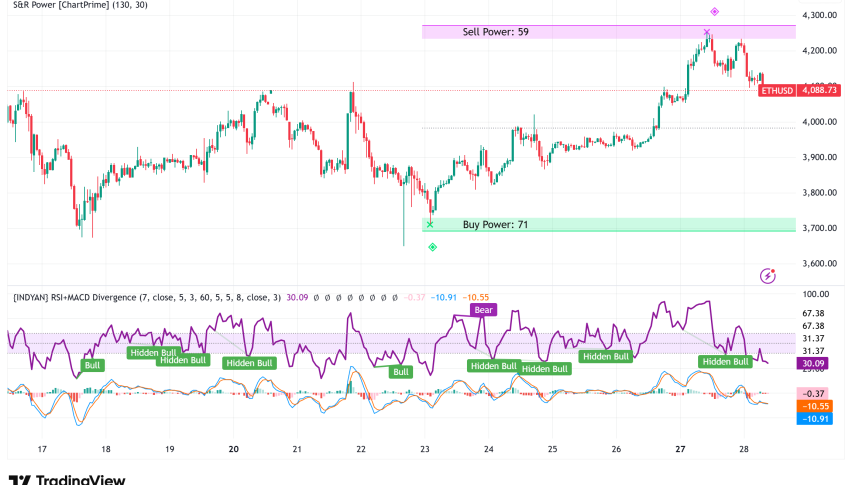
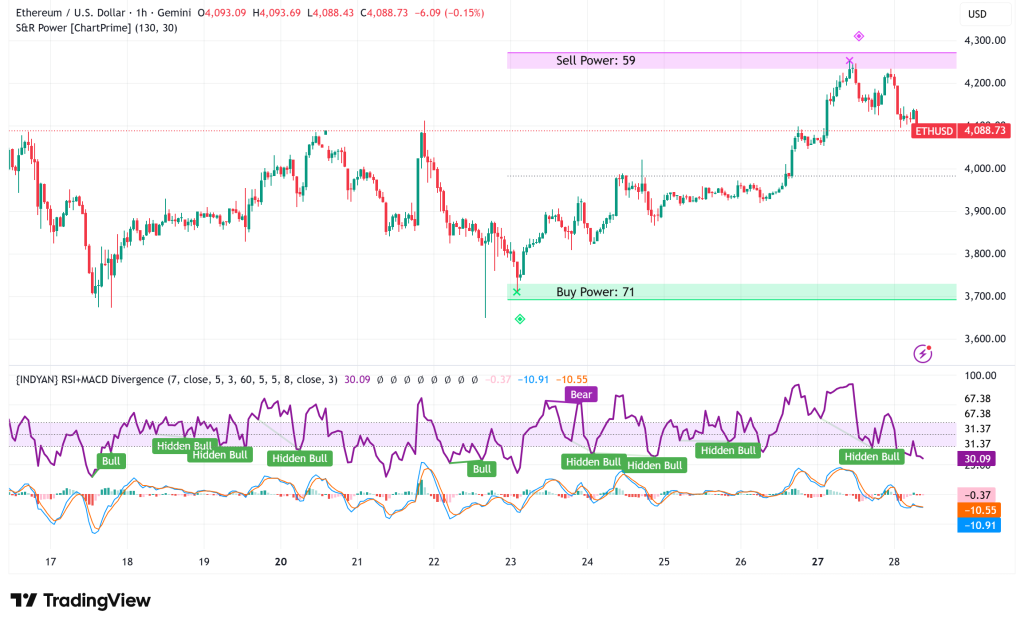
Ethereum’s price motion right now shows that it is in a consolidation period after breaking through the $4,000 and $4,120 resistance levels earlier this week. The cryptocurrency hit a local high of $4,252 before going into its current downward phase.
ETH is currently trading above both the $4,080 level and the 100-hourly Simple Moving Average. A positive trend line is developing support at $4,055. The cryptocurrency has stayed above the 23.6% Fibonacci retracement line of its recent gain from $3,708 to $4,252, which shows that it is still strong even though it has pulled down a little.
But technical indicators are sending contradictory signals. The hourly MACD is slowing down in the positive zone, and the Relative Strength Index (RSI) has fallen below 50, which means that short-term momentum is neutral to slightly bearish.
Bitcoin Correlation Creates Market-Wide Volatility
The cryptocurrency market as a whole is still weak after Bitcoin’s liquidity flush near $116,000, which has hurt sentiment across altcoins. Can Özsüer, a technical analyst, said that Bitcoin’s hourly chart “shows little to no bullish reflection at the moment,” and that the market is still sluggish after the $116,000 liquidity zone was cleared.
Özsüer said that $111,000 could be a good place for Bitcoin to buy back, and that the $109,000 trendline could be a stronger support level. Ethereum has had a hard time because of Bitcoin’s downturn, but ETH has shown relative resilience by staying over $4,000.
The $4,200 Battle: Gateway to Continuation or Correction
Ted Pillows, a crypto analyst, said that Ethereum is currently in a “critical fight” to get back to the $4,200 resistance zone. This level has become the key battleground that will decide where ETH goes in the near future.
Pillows said, “If Ethereum can decisively reclaim and hold the $4,200 level, expect more bullish continuation.” If the price successfully reclaims, it will likely gain momentum toward higher price objectives and show that the present rally is strong.
On the other hand, if the price doesn’t break above $4,200, it will probably challenge the $4,000 psychological support level again. The main support structure is between $4,050 and the trend line. There is also deeper support at $3,980, which is the 50% Fibonacci retracement level. If Ethereum breaks below these levels, it could drop to $3,840 or perhaps $3,780 in a bearish scenario.
Institutional Support Bolsters Long-Term Outlook
Growing interest from institutions makes the bullish technical setup more stronger. Standard Chartered Bank has boosted its price prediction for Ethereum in 2025 to $7,500. It also said that the price might reach $25,000 by 2028 if it keeps going up. This institutional approval makes the more aggressive retail analyst estimates more believable.
Ethereum ETF inflows have been strong in the past few weeks, and institutional investors are starting to see ETH as more than just a risky investment. The network’s move to proof-of-stake, along with continued scaling solutions and layer-2 development, keeps bringing in long-term investments.
Ethereum Price Prediction and Trading Strategy
The $4,200 level is the most important place for traders to make decisions in the present market. If the price breaks over this resistance level with a lot of volume, it would confirm bullish continuation strategies that aim for $4,320, $4,480, and eventually $4,500 in the near future.
But the mixed technical signs and the fact that Bitcoin’s market is correlated with other markets imply that prudence is needed. The RSI is below 50 and the MACD momentum is getting weaker, which means that the rise may need to consolidate more before trying to reach higher levels.
Before opening new long positions, conservative traders might want to wait for either a clear breakout over $4,200 or a test of lower support levels between $4,000 and $4,050. At $4,050, there is a critical support level that acts as a line in the sand. If the price stays above this level, the immediate bullish structure will stay in place. If it breaks down, it might mean a further fall toward $3,980 or lower.
Elliott Wave Analysis Points to $16,000 Long-Term Target
Freedomby40, a crypto analyst, has done an interesting Elliott Wave study that suggests Ethereum might hit $16,000 in the current market cycle, even though it is now consolidating. The analysis shows that ETH is in a long-term bullish sequence that started to build in late 2022.
The Elliott Wave structure says that Ethereum has finished a corrective phase and is currently starting a new impulse wave. Support has formed between $3,225 and $3,563 at important Fibonacci retracement levels. The analyst calls this “the ideal accumulation area for the next leg up.”
The research shows that Ethereum is presently in the middle of its fifth major impulse wave, which has an internal C wave structure with smaller sub-impulse waves. Freedomby40 said, “Within that C wave, Ethereum seems to be entering its own fifth sub-wave, which is known to be a decisively bullish wave.”
Fibonacci Extensions Map Path to New All-Time Highs
The Elliott Wave analysis shows several price targets based on Fibonacci extensions:
- $6,303 — The 1.0 Fibonacci extension, which is the first big breakout above the current all-time high
- $9,013—the 1.236 extension, which is called a “very realistic” aim
- $11,210—the 1.382 extension, which is a mid-range bull case scenario
- $16,077—the 1.618 extension, which is the highest target for this wave cycle
The researcher said that these estimates fit with the wave structure patterns seen in Ethereum’s bull cycles in 2017 and 2021, which means that a move of the same size might be happening.
- Check out our free forex signals
- Follow the top economic events on FX Leaders economic calendar
- Trade better, discover more Forex Trading Strategies
- Open a FREE Trading Account
- Read our latest reviews on: Avatrade, Exness, HFM and XM
Related Articles
Sidebar rates
Related Posts
