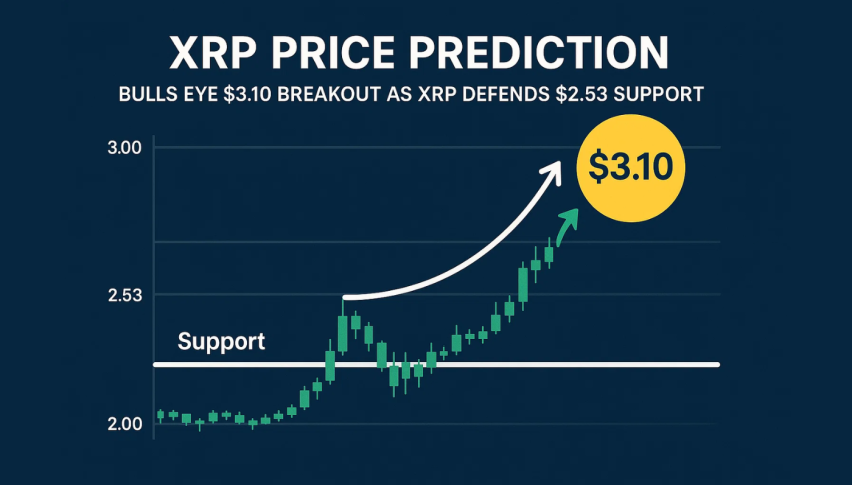
XRP Price Prediction: Bulls Eye $3.10 Breakout as XRP Defends $2.53 Support
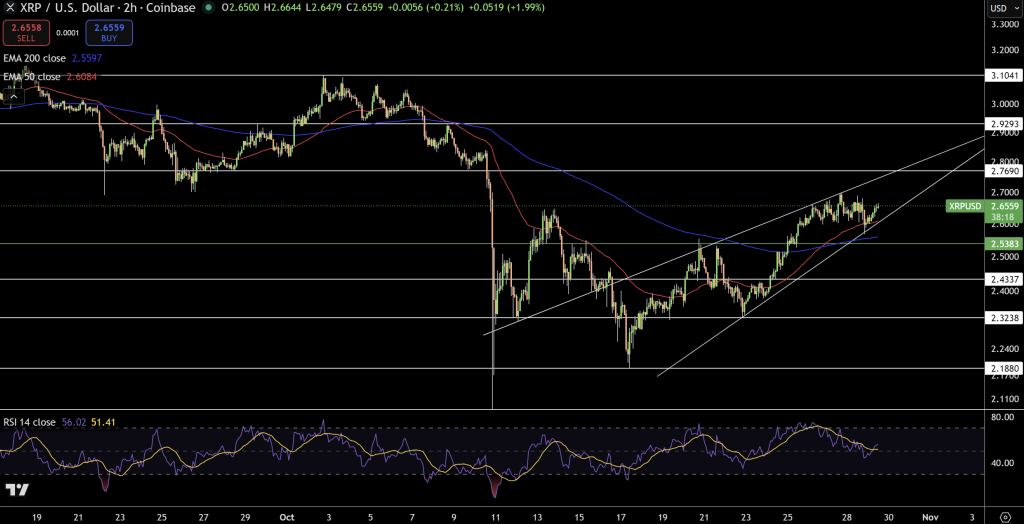
XRP is trading around $2.66, holding steady right above its 50 day EMA at $2.60 a level that tends to mark a kind of boundary...
Quick overview
- XRP is currently trading at $2.66, maintaining support above its 50-day EMA at $2.60, indicating a potential bullish trend.
- The price is forming an ascending wedge pattern, suggesting a breakout could be imminent, with targets of $2.77, $2.92, and possibly $3.10.
- Momentum indicators like the RSI are showing strength, indicating strong buying interest without being overbought.
- A decisive break below $2.53 could lead to lower levels around $2.43 and $2.32, but the overall outlook remains positive for bulls.
XRP is trading around $2.66, holding steady right above its 50 day EMA at $2.60 a level that tends to mark a kind of boundary between the bulls and the bears. The token’s price is forming an ascending wedge – a pattern a lot of us see before a big move is about to happen. As XRP is stuck near the top of the wedge, everyone’s just waiting for a breakout that’ll give us a clear idea of what’s next.
The 200 day EMA which sits just south of $2.55 is also telling us that a area around $2.53-$2.55 is super important for the buyers. If that support cluster holds up and keeps going then XRP is still looking pretty good for further gains.
Momentum Builds as RSI Shows Strength
The momentum indicators are actually going along with the bullish story. The relative strength index is sitting at 56 which suggests people are buying in pretty strongly but not too strongly – still got some room to run. After the last pull back we’re seeing some spinning top and doji candles which generally means people are thinking twice before taking a bet but it also often means a rally is just around the corner.
If that next big rally holds up, in the form of a bullish engulfing candle, then XRP could see renewed interest and push towards $2.77, $2.92 and maybe even $310. We’ve seen higher lows since mid-October so this is all looking pretty good for the bulls.
Upside Scenario and Risk Levels
XRP’s chart suggests a market that’s pausing rather than reversing. A break below $2.53 could expose $2.43 and $2.32, though these levels currently look defensive. For traders, the setup remains clear — stay long above $2.55, with upside targets toward the wedge breakout.
Key factors reinforcing the trend include:
- Sustained support at the 200-day EMA
- RSI divergence signaling hidden strength
- Formation of bullish engulfing candles near the support base
XRP Outlook: Bulls Target $3.10 Ahead of Year-End
If XRP breaks decisively above $2.77, it could accelerate toward $3.10, potentially marking the start of a broader altcoin rally into year-end. With improving technical momentum and consistent institutional interest, XRP may soon shift from consolidation to expansion — a move that could define the next leg of crypto market optimism.
- Check out our free forex signals
- Follow the top economic events on FX Leaders economic calendar
- Trade better, discover more Forex Trading Strategies
- Open a FREE Trading Account
