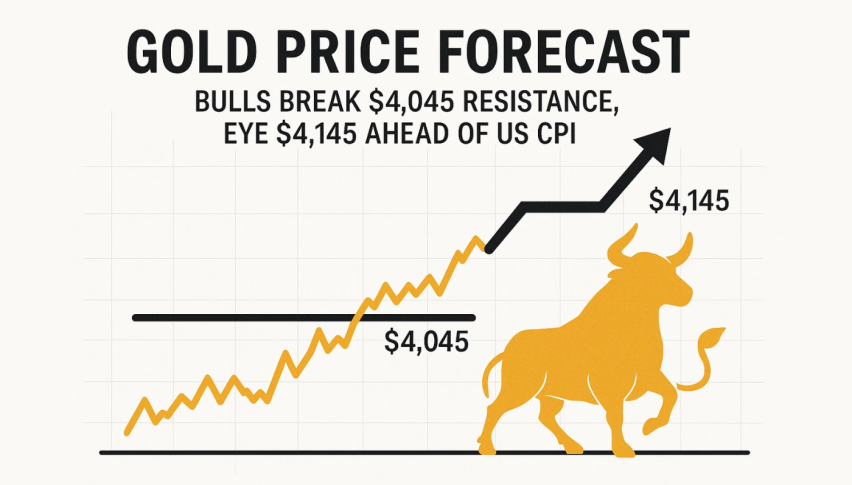
Gold Price Forecast: Bulls Break $4,045 Resistance, Eye $4,145 Ahead of US CPI
Gold (XAU/USD) surged above the critical $4,045 resistance mark during the Asian session on Monday. It's signaling renewed bullish...
Quick overview
- Gold (XAU/USD) has broken above the $4,045 resistance level, indicating bullish momentum ahead of US inflation data.
- The metal is benefiting from expectations of a December Fed rate cut and increased safe-haven demand due to the prolonged US government shutdown.
- Traders are focused on upcoming economic reports, with any signs of softening inflation potentially boosting gold prices further.
- Technical indicators suggest a bullish outlook for gold, with key support at $3,965 and potential targets of $4,142 to $4,227.
Gold (XAU/USD) surged above the critical $4,045 resistance mark during the Asian session on Monday. It’s signaling renewed bullish momentum ahead of this week’s high-impact US inflation figures. This breakout is confirming an upside move from the ascending triangle pattern that’s been building since early October. Prices are now testing the $4,054 zone, with traders eyeing further upside toward $4,142 and $4,227 if bullish momentum holds.
The yellow metal continues to benefit from expectations of a December Fed rate cut, with the CME FedWatch Tool showing a 67% probability. The prolonged US government shutdown, now over five weeks old, and legal uncertainty around tariffs have amplified safe-haven demand, keeping gold resilient above the $4,000 psychological level.
Inflation and Retail Data in Focus
Traders are bracing for a busy week of US economic data, which could dictate gold’s next direction:
- Nov 13: Core CPI m/m (0.3% forecast vs 0.2% prior)
- Nov 14: Core PPI m/m and Retail Sales m/m reports
- Nov 12: FOMC Member Waller Speech
Any softening in inflation or retail spending could reinforce expectations of a policy pivot, pressuring the dollar and fueling another leg higher in gold.
Gold (XAU/USD) Technical Outlook: Trendline Support Intact
Gold’s 4-hour chart shows price action supported by the ascending trendline near $3,965. The 20-EMA has turned upward, while the RSI (64) signals strengthening bullish momentum without yet reaching overbought territory.
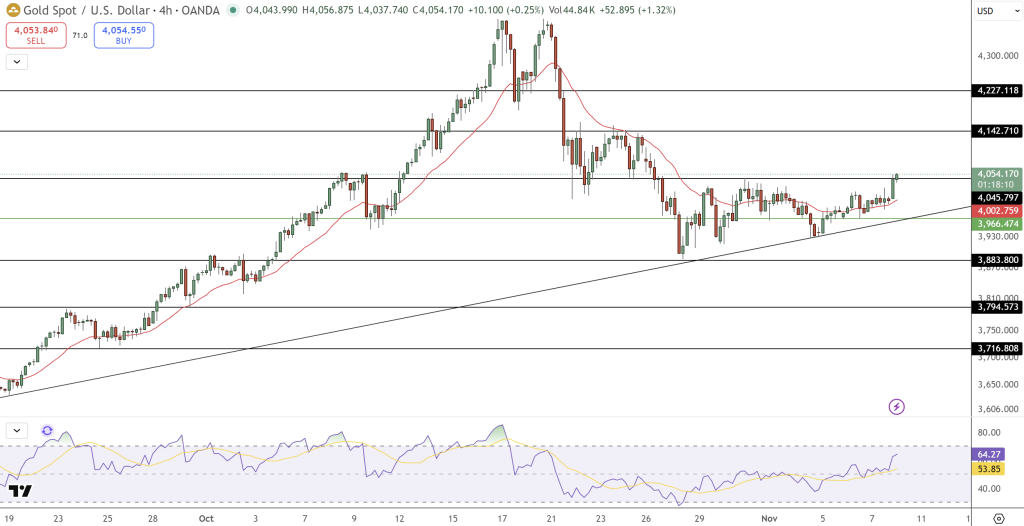
A sustained close above $4,045 would confirm a breakout, paving the way toward $4,142–$4,227. On the downside, failure to hold above $3,965 could trigger a pullback toward $3,883 — a zone likely to attract renewed buying interest.
Gold (XAU/USD) Outlook
Gold’s technical structure now favors the bulls. With inflation and retail sales data due this week, any dovish signal from the Fed narrative could drive XAU/USD’s next leg higher, keeping the $4,145–$4,225 range firmly in sight.
- Check out our free forex signals
- Follow the top economic events on FX Leaders economic calendar
- Trade better, discover more Forex Trading Strategies
- Open a FREE Trading Account
- Read our latest reviews on: Avatrade, Exness, HFM and XM