Bitcoin Consolidates at $103K While Technical Indicators Point to Bullish Long-Term Structure
Bitcoin is trading about $103,000 right now, which is 3.5% less than it was 24 hours ago. This is a very important technical point for the
Quick overview
- Bitcoin is currently trading at approximately $103,000, down 3.5% from the previous day, with analysts predicting a potential rise to $200,000 or more in the coming months.
- Market expert Gert Van Lagen suggests that Bitcoin has completed its corrective phase and is now in a Wave III expansion, which historically leads to significant price increases.
- While the long-term outlook for Bitcoin remains positive, short-term market activity shows mixed signals, with a decline in futures trading and institutional involvement.
- Technical indicators suggest Bitcoin must break above $105,000 to maintain bullish momentum, or it may test lower support levels around $100,000.
Bitcoin BTC/USD is trading at about $103,000 right now, which is 3.5% less than it was 24 hours ago. This is a very important technical point for the top cryptocurrency, and it could affect its path until the end of 2025. Even if Bitcoin is sluggish right now, analysts are becoming more sure that it is getting ready for a big parabolic explosion that may push prices up to $200,000 or more.
Elliott Wave Analysis Signals Major Breakout Ahead
Market expert Gert Van Lagen thinks that Bitcoin’s corrective Wave II phase is over, and the cryptocurrency has bounced back from its 40-week simple moving average, which is a historically important support level. Van Lagen’s “step-like” Elliott Wave model says that Bitcoin is now in Wave III expansion, which has happened before when prices have gone up quickly.
This technical framework says that when Wave III is over, the price of Bitcoin might go up to between $200,000 and $240,000 in the next few months. This model is based on what happened in 2019 and 2023, when comparable consolidation phases happened before big breakouts. The way the price is moving right now makes it look like Bitcoin is building a strong base before its next parabolic ascent.
Crypto trader Jelle agrees with this positive view, saying that Bitcoin is still testing resistance at the middle of its long-term rising price channel. Once this level is broken, the channel’s upper border suggests a possible goal near $350,000, which means that patient investors might make a lot of money.
Macroeconomic Tailwinds Could Fuel Risk-On Sentiment
In addition to pure technical analysis, macroeconomic considerations may soon help Bitcoin’s next rise. Sminston, a researcher The US Purchasing Managers’ Index has been below 50 for almost three years, which is the longest economic slump since records began in 1948. In the past, long downturns like this one have been followed by significant recoveries when economic cycles return to their average levels.
This expected economic rebound could bring investors back to riskier assets, and Bitcoin, which is a high-growth, speculative asset, could benefit the most when people start to trust the market again. The combination of a good technical setup and better overall economic conditions could be a strong reason for Bitcoin’s next big move.
Mixed Signals in BTC Derivatives and Spot Markets
The long-term view is still very positive, but the short-term price activity tells a more complicated story. Bitcoin recently completed the CME gap that happened over the weekend and is now trying to find support over $105,000. However, futures open interest has gone down since the liquidation event in October, and derivatives trading has slowed down on all exchanges.
According to Glassnode, the average size of Bitcoin futures orders has dropped dramatically. This is because institutional players and whales are less involved, while retail traders have more power. Since early October, US spot Bitcoin ETFs have primarily seen money leave them. This is a sign that institutional investors are de-risking more broadly.
But there may be a big change happening in spot markets. Julio Moreno, the head of research at CryptoQuant, said that the “Apparent Demand” statistic, which shows the difference between Bitcoin’s production and changes in its inventory, has gone up for the first time since early October. This 30-day total indicator implies that spot buying demand is growing again after a month-long slump.
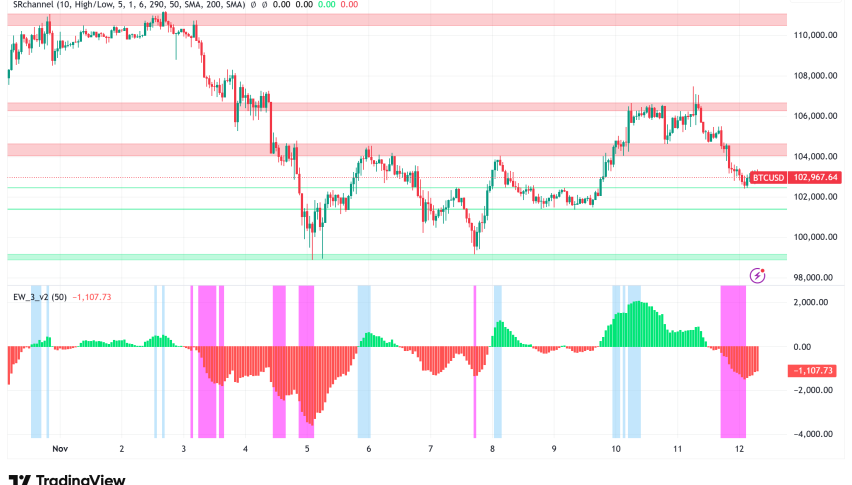
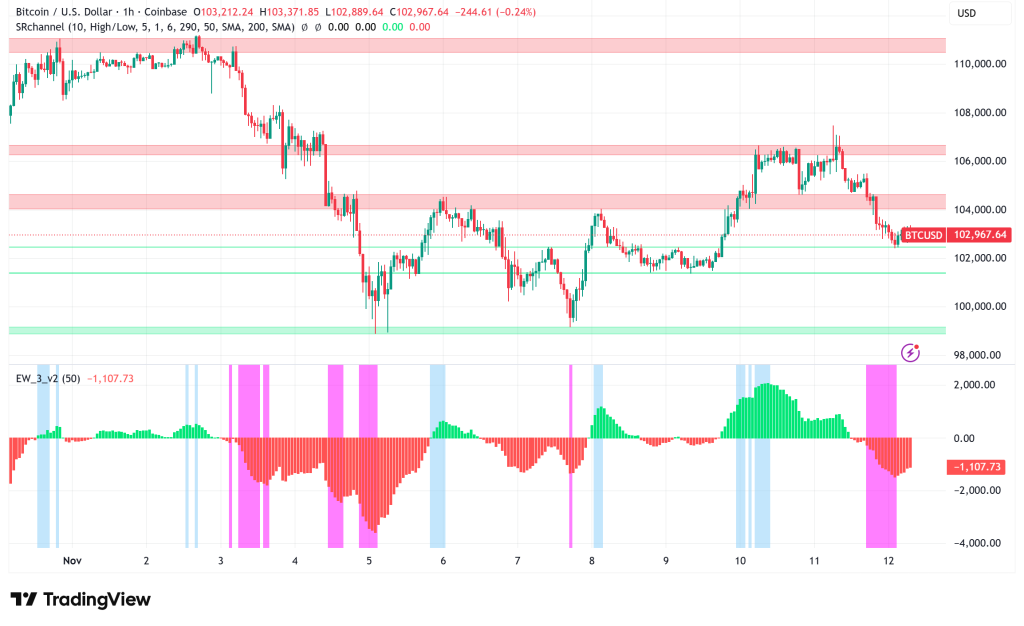
BTC/USD Technical Support and Resistance Levels
Bitcoin is having trouble right now above $104,000, with important levels between $104,750 and $105,500. If the price breaks above $105,500, it might go back to $107,000 and maybe even $108,800. On the downside, support is at $102,800, and more important support is at $102,400, which is the 61.8% Fibonacci retracement line. If Bitcoin breaks below this level, it might challenge $101,200 or perhaps $100,000.
Technical indicators paint a cautious picture: the hourly MACD is gaining strength in bearish zone, and the RSI has fallen below 50, which means that the market is weak in the short term. However, Hyblock Capital’s onchain liquidation patterns suggest that groups of protracted liquidations near $100,000 have happened before little recoveries, which could mean that the market is going back to its average.
Bitcoin Price Prediction: Bullish Long-Term, Cautious Near-Term
If the Wave III expansion goes as planned, Bitcoin looks like it will have a big rally toward $200,000-$240,000 in the next few months. This is based on the convergence of Elliott Wave research, macroeconomic considerations, and rising spot demand. The upper limit of the long-term price channel, which is close to $350,000, is a hopeful but realistic goal for the highest point of this cycle.
But traders should be careful in the short term. Bitcoin has to get back above $105,000 and stay there to show that bullish momentum is strong. If you don’t accomplish this, the $100,000 psychological support threshold might be tested again. The recent ETF outflows and modest derivatives activity imply that market players are still cautious. However, the resumption of positive spot demand suggests that accumulation may be happening quietly at these levels.
- Check out our free forex signals
- Follow the top economic events on FX Leaders economic calendar
- Trade better, discover more Forex Trading Strategies
- Open a FREE Trading Account
- Read our latest reviews on: Avatrade, Exness, HFM and XM
Related Articles

Sidebar rates
Related Posts
