Nvidia Stock Tumbles Over 15% During Market Sell-Off

Quick overview
- Nvidia's stock has dropped 15% this month amid a market selloff, raising concerns about potential further declines.
- Key support levels include the 50-day EMA near $186 and the 0.382 Fibonacci level around $165, with critical medium-term support at $154.
- Despite the recent pullback, long-term indicators like the EMAs suggest a bullish trend remains intact as long as key support levels hold.
- Short-term indicators show mixed signals, with bearish MACD crosses on shorter timeframes but a bullish structure indicated by the EMAs.
This month, Nvidia (NVDA) stock has dropped sharply by 15% amid a broad market selloff. The key question now: will the correction continue, or is a rebound imminent?
Nvidia Stock Drops 15% — Is More Downside Ahead?
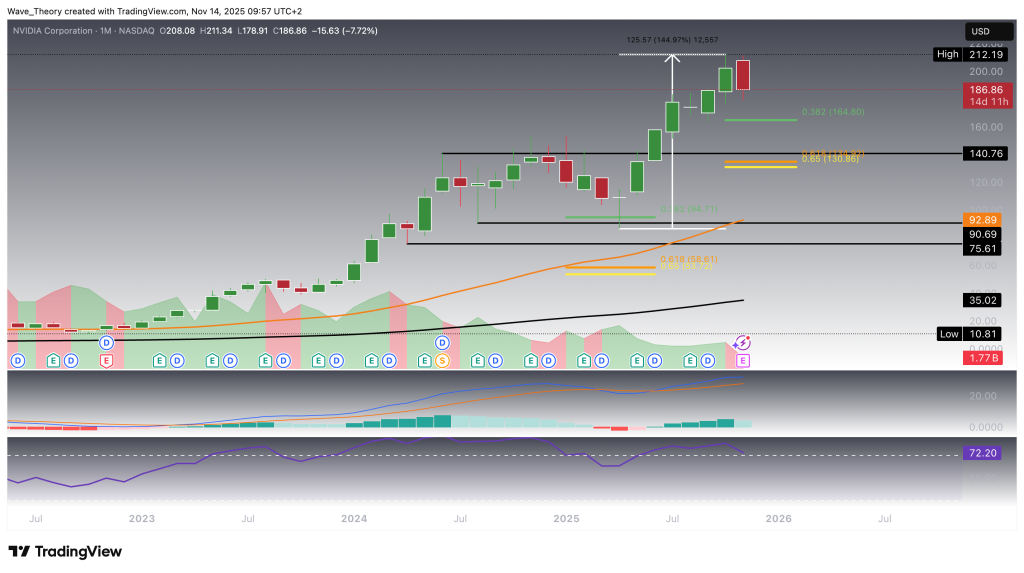
Nvidia’s stock has fallen sharply this month, dropping around 15%, and the technical structure suggests that further downside remains possible. If the decline extends, NVDA could retest the 0.382 Fibonacci support near $165, a key level where buyers may step in and reassert the broader uptrend. Should this level fail to hold, the next major support zone lies between the golden ratio at $130 and the historical support around $141.
Despite the recent pullback, the MACD lines remain bullishly crossed, and the EMAs continue to confirm a long-term bullish trend, suggesting that broader momentum remains intact. However, early signs of cooling are visible: the MACD histogram has begun ticking lower, and the RSI has exited overbought territory, returning to neutral levels and signaling a moderation in upside momentum.
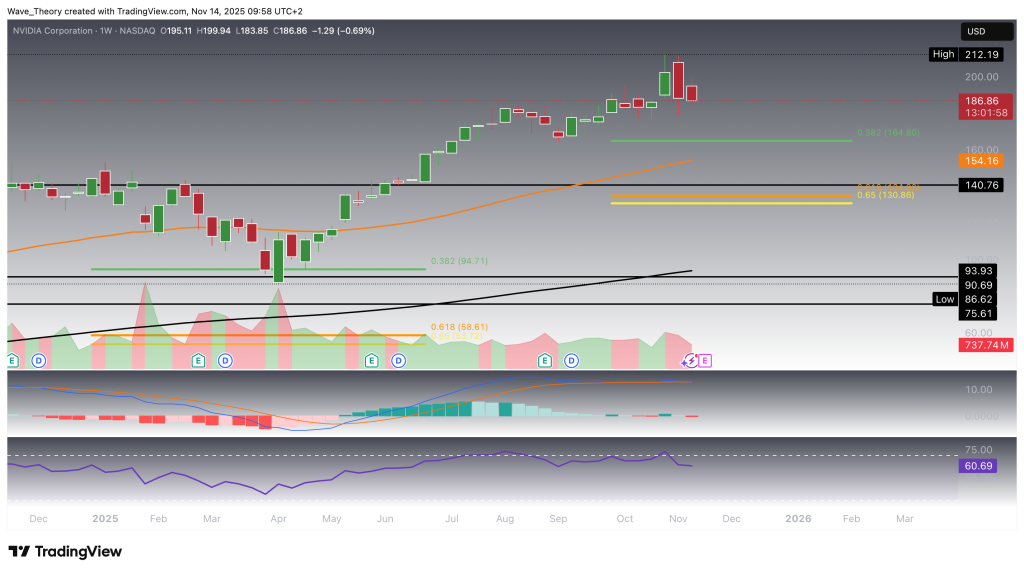
More Bearish Signals on the Nvidia Weekly Chart
On the weekly chart, indicators present a mixed picture. The EMAs continue to display a golden crossover, confirming a mid-term bullish trend, while the MACD lines remain bullishly crossed and the RSI stays in neutral territory. However, the MACD histogram began trending lower last week, signaling growing short-term bearish pressure. Should Nvidia extend its correction, the 50-week EMA near $154 provides a key support level.
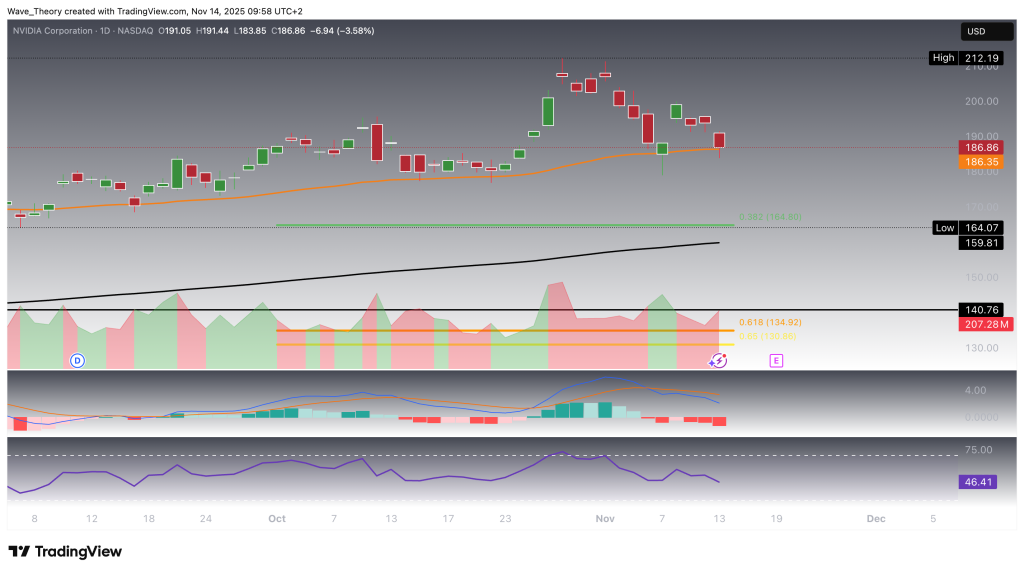
Nvidia Finds Immediate Support at the 50-Day EMA
Nvidia currently finds key support at the 50-day EMA near $186, which could provide a bullish bounce toward the all-time high at $212. If this support fails, the stock may extend its decline toward the 0.382 Fibonacci level around $165 or even the 200-day EMA near $160. In the short term, the MACD lines have crossed bearishly and the MACD histogram is trending lower, while the RSI remains in neutral territory. Nonetheless, the EMAs continue to display a golden crossover, confirming a bullish structure in the short- to medium-term trend.
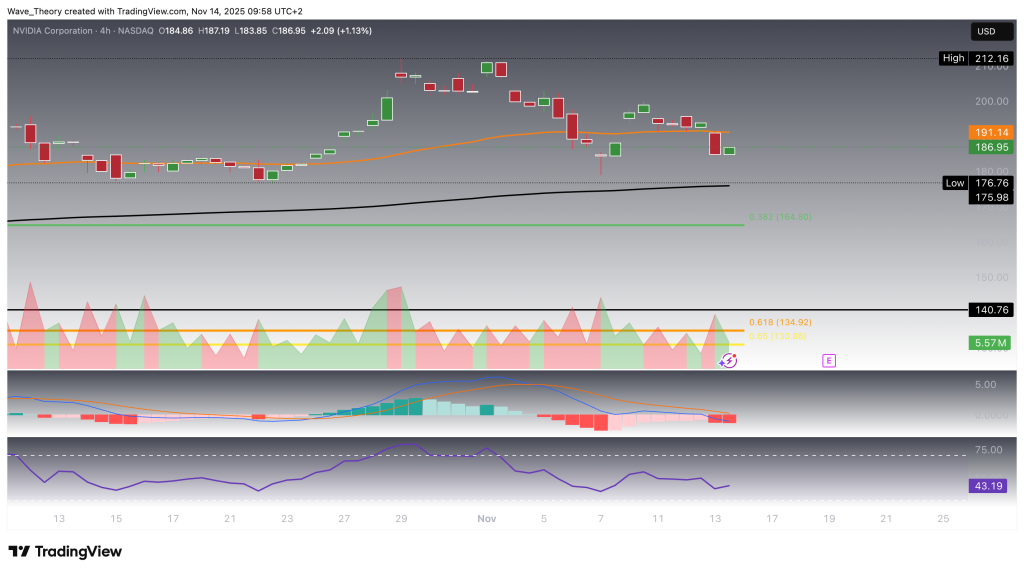
Similar Outlook on the 4-Hour Chart: Mixed Signals for Nvidia
On the 4-hour chart, indicators present a mixed picture. The MACD lines have crossed bearishly and the MACD histogram is trending lower, while the RSI remains neutral. Meanwhile, the EMAs continue to display a golden crossover, supporting a short-term bullish trend. Currently, Nvidia remains in an ongoing correction phase as long as the stock does not decisively break above the golden ratio resistance near $201.
Nvidia Stock Technical Summary
-
Current Price: ~$187
-
Short-Term Resistance: Golden ratio at $201,
-
Short-Term Support: 50-day EMA near $186–$187, 0.382 Fibonacci at $165, 200-day EMA near $160
-
Medium-Term Support: 50-week EMA at $154
-
Long-Term Support: Golden ratio at $130, historical support near $141
-
Indicators:
-
MACD: Mixed — bearishly crossed on 4H/daily charts, bullishly crossed on weekly/monthly charts; histogram ticking lower
-
RSI: Neutral across most timeframes
-
EMAs: Golden crossover intact → trend bullish in short- to long-term
-
Outlook:
-
Short-term: Ongoing correction; a break above $201 could resume bullish momentum.
-
Medium-term: Support at $154–$165 critical to maintain bullish structure.
-
Long-term: Trend remains bullish as long as weekly/monthly EMAs and key support levels hold.
- Check out our free forex signals
- Follow the top economic events on FX Leaders economic calendar
- Trade better, discover more Forex Trading Strategies
- Open a FREE Trading Account
- Read our latest reviews on: Avatrade, Exness, HFM and XM