XRP Faces Critical Test at $2 as 41.5% of Supply Sits Underwater Despite Incoming ETF Wave
XRP is going through a rough patch right now. It is trading at $2.15, which is a dip of around 5% in the last 24 hours and a huge 40% from
Quick overview
- XRP is currently trading at $2.15, down 5% in the last 24 hours and 40% from its all-time high of $3.65.
- Approximately 41.5% of XRP holders are currently at a loss, contributing to negative market sentiment and potential selling pressure.
- Analysts indicate that XRP must break through the $2.220 resistance level to avoid further declines towards $2.10 and below.
- The upcoming launch of multiple XRP ETFs could provide a much-needed boost, but immediate market reactions remain subdued.
XRP XRP/USD is going through a rough patch right now. It is trading at $2.15, which is a dip of around 5% in the last 24 hours and a huge 40% from its all-time high of $3.65 in July. Market experts are saying that the digital asset’s existing structure looks more and more unstable, and a lot of holders are sitting on unrealized losses that could lead to more selling pressure.
According to Glassnode, the amount of XRP that is currently profitable is at its lowest level in 12 months. About 26.5 billion XRP tokens, or 41.5% of the total supply, are currently held at a loss. This uneven distribution at the top shows that a lot of people bought XRP when it was near its recent highs, especially when it was above $3.00 in January and all summer long.
XRP/USD Technical Analysis Points to Make-or-Break Levels
Tony Sycamore, an IG Australia market analyst, says that the current sell-off “blindsided both long-term holders expecting perpetual upside and newer entrants who bought near the highs due to FOMO.” The large unrealized losses are now having a big effect on market sentiment, and people are worried about stop-losses that could cause prices to drop even faster.
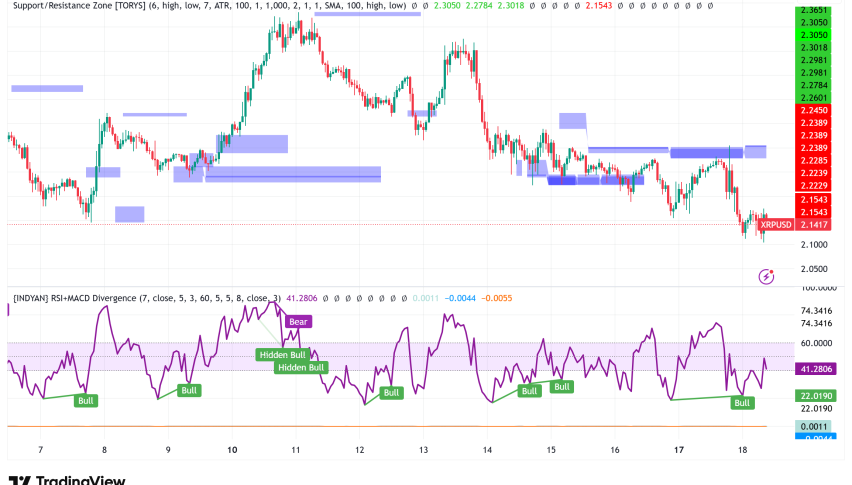
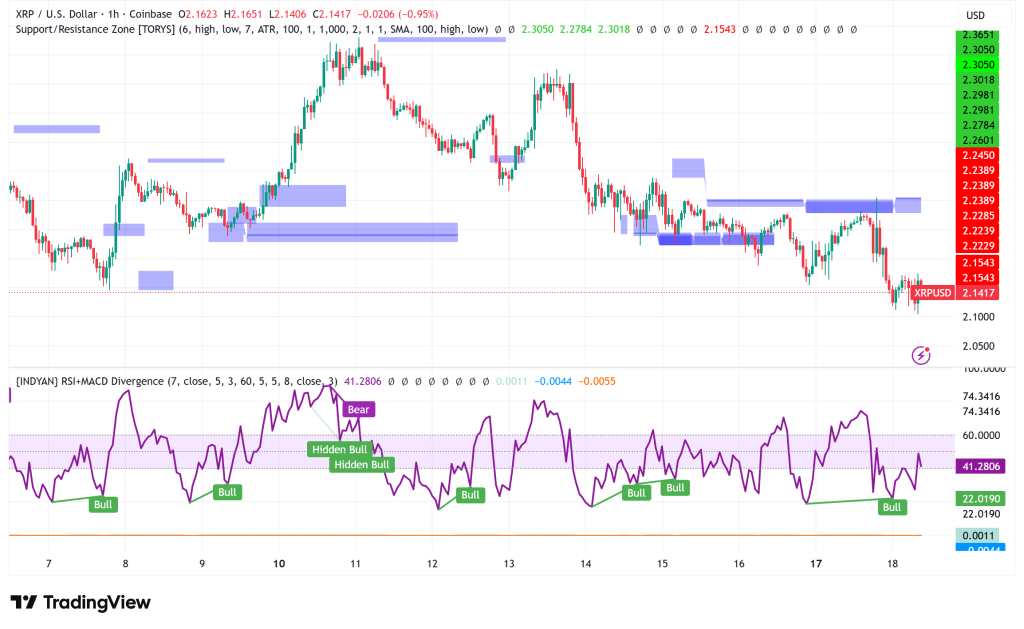
XRP is trading below the important $2.20 level and the 100-hourly Simple Moving Average, and a negative trend line is creating resistance at $2.220. The cryptocurrency is holding steady below the 23.6% Fibonacci retracement level, which means that there isn’t much purchasing pressure at these rates.
The hourly MACD is getting stronger in negative territory, and the Relative Strength Index has dipped below the neutral 50 mark. This is not a good sign. Analysts say that if XRP can’t break through the $2.220 resistance level, the initial support level at $2.120 could give way, which could lead to more down toward $2.10 and $2.05.
Will XRP ETF Launches Provide the Catalyst Bulls Need?
XRP fans are still hopeful for a record number of exchange-traded funds to start this week, even though the technical setup is bearish. Canary Capital’s XRPC launch on November 13 broke records, bringing in $58 million in first-day volume and $245 million in inflows. This was more than any other US ETF launch in 2025. Four more spot XRP ETFs from Franklin Templeton, Bitwise, 21Shares, and CoinShares are set to launch soon.
JPMorgan thinks that XRP ETFs might bring in between $4 billion and $8 billion in the first year, which could give the market the institutional money it needs to stabilize prices. The last REX/Osprey XRPR ETF debut led to an 18% rise in the price before it even started, and it swiftly gained $150 million in assets under management.
But the market’s immediate reaction to these changes has been subdued, with prices continuing to fall even though ETFs have had a lot of success in the past.
XRP Price Prediction: Recovery Hinges on Decisive Breakout
Marzel, a crypto analyst, says that XRP is “consolidating above $2 in a pennant, signaling a potential bottom.” However, he stresses that a breakout above $2.62 would be needed to confirm a bullish reversal. CoinGlass’s liquidation data shows that there are strong resistance levels between $2.34 and $2.67. This means that any attempt to rebound will face a lot of selling pressure.
Sycamore says that “recovery will require a decisive rebound back above $2.70” for bulls to get back in charge. This would mean getting over a lot of obstacles, such the bearish trend line at $2.220, and then the $2.28, $2.32, and $2.40 levels.
On the other hand, if the $2.10 support level isn’t defended, losses could happen faster, bringing the price down to $2.05 and possibly $1.88, which would be a 12% drop from where it is now. The market seems to be at a turning point, and the next 48 hours will likely show whether institutional ETF demand can make up for the structural weakness caused by millions of retail investors who are underwater.
- Check out our free forex signals
- Follow the top economic events on FX Leaders economic calendar
- Trade better, discover more Forex Trading Strategies
- Open a FREE Trading Account
- Read our latest reviews on: Avatrade, Exness, HFM and XM