Bitcoin Holds $92,000 as Nvidia Earnings Spark Tech Recovery, But Downside Risks Persist
Bitcoin (BTC) is currently worth about $92,000. It has been relatively stable over the past 24 hours, after a week of ups and downs that saw
Quick overview
- Bitcoin is currently valued at approximately $92,000, showing stability after a week of volatility that saw a decline of over 10%.
- Despite a recent rebound, Bitcoin remains under bearish pressure, trading below critical resistance levels and facing immediate challenges at $92,500 and $93,500.
- The Bitcoin derivatives market has shown resilience, with traders maintaining a cautious outlook despite recent price drops and ETF outflows totaling over $2.26 billion.
- Future price movements for Bitcoin are likely to depend on broader economic conditions and the performance of the tech sector, with key resistance at $93,500 and support levels around $90,000.
Bitcoin BTC/USD is currently worth about $92,000. It has been relatively stable over the past 24 hours, after a week of ups and downs that saw the cryptocurrency decline more than 10%. On Wednesday, the digital currency tested a key support level near $88,500 before making a little rebound. This happened at the same time as chip giant Nvidia announced record third-quarter earnings, which sent both crypto and tech equities higher in after-hours trading.
Bitcoin bulls are happy to see the price rise again after it dropped below $89,000 for the first time since late April. Nvidia’s record $57 billion in quarterly revenue, which was more than $2 billion above than Wall Street’s projections, helped ease fears of an AI bubble and gave risk assets, like cryptocurrencies, a short-term boost.
BTC/USD Technical Analysis: Bears in Control Below Key Resistance Levels
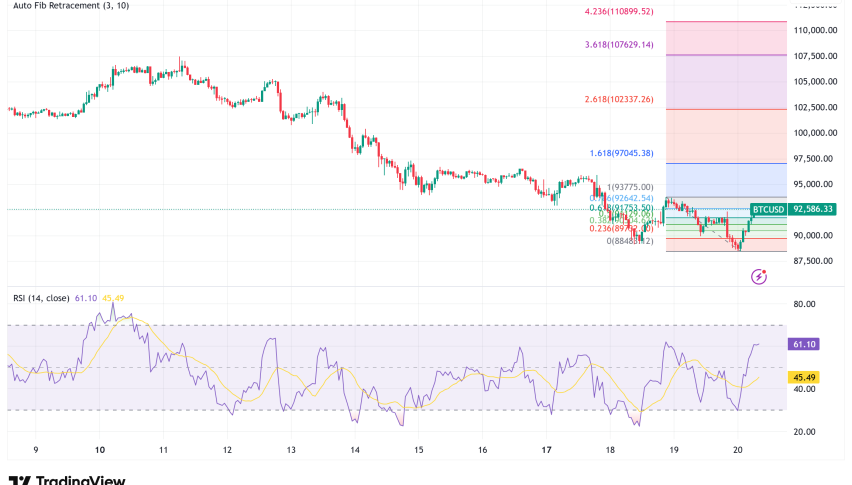
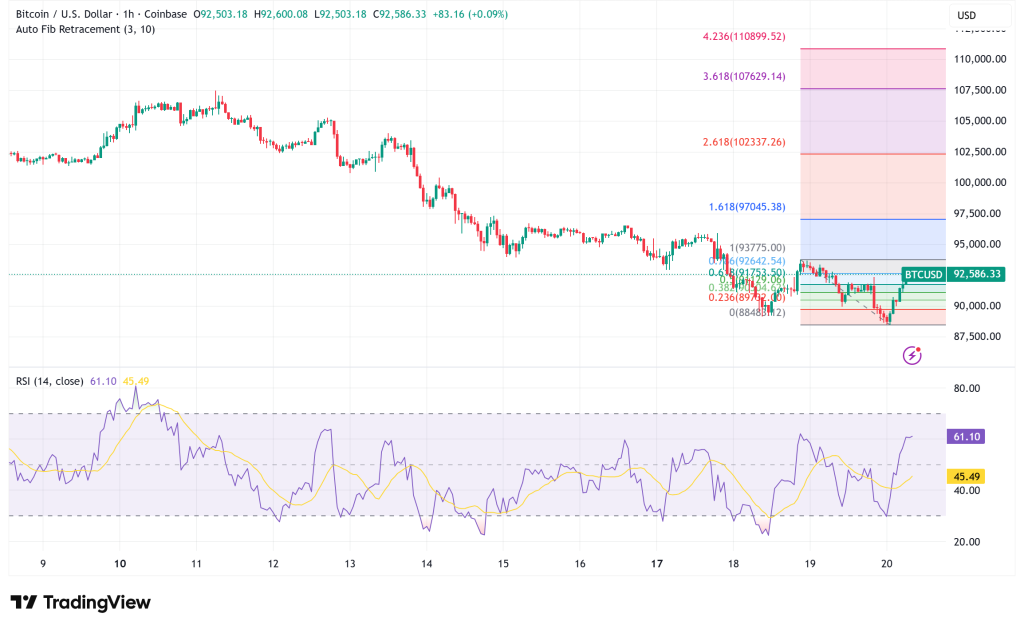
Even though it has bounced back recently, Bitcoin is still in a bad technical position. The cryptocurrency is trading below the $93,000 level, which is critical for the mind, and the 100-hour simple moving average, which means that bearish pressure is still there.
The hourly chart shows a negative trend line with resistance at $93,500. If bulls try to start a recovery wave, they will face immediate resistance at $92,500, which is the 76.4% Fibonacci retracement level of the latest drop from $93,747 to $88,570. The first big resistance zone is still above $93,500, where the trend line meets.
If it breaks above $93,500, it might test $93,750, and then $94,500 and $95,000 would be the next levels of resistance. But technical indicators show that this upward route has a lot of problems. The hourly MACD is losing strength in the bearish zone, but the RSI has gone back above 50, which means there is still some buying pressure.
On the downside, immediate support is at $91,150, while major support is at $90,500 and $90,000. If Bitcoin doesn’t hold these levels, it could test the $88,500 support zone again. The key support level is at $86,500, which could cause the price to drop even faster.
BTC Derivatives Market Shows Resilience Despite Price Weakness
Even if the price has gone down, the Bitcoin derivatives markets have been surprisingly stable, which means that traders aren’t in a lot of trouble yet. The monthly futures premium was close to 4% higher than spot markets on Wednesday, which is a little below the neutral 5% level. This means that even while people are worried, there isn’t a lot of bearish confidence that usually comes before capitulation occurrences.
The permanent futures financing rate is close to 4%, which is in line with the two-week average and shows a modestly negative attitude without any symptoms of panic. The options delta skew, on the other hand, stayed at 11%, which means that put options are still trading at a higher price than call options. This means that whales and market makers are still worried about losing money, but the current levels are not very stressful.
It’s interesting to note that the derivatives market hasn’t displayed the kind of turmoil that usually happens when key trends change, even though $144 million in leveraged long bets have been liquidated. This strength could mean that traders are ready for a possible bounce, even though they are still using protective hedges.
Macro Headwinds and Bitcoin ETF Outflows Weigh on Sentiment
Bitcoin still has a hard time in the bigger picture. Over the past five sessions, spot Bitcoin ETFs have seen net outflows of more than $2.26 billion. This has created constant selling pressure as market makers spread out execution throughout trading days. This is less than 2% of the whole Bitcoin ETF market, but the steady outflows show that institutional investors are losing interest.
Also, big tech stocks have dropped by 19% or more in the last month. This is because people are worried about the bad US job market and inflation, which makes it harder for the Federal Reserve to decrease interest rates. The recent US government shutdown, which lasted until November 12, has also affected how people feel about spending, and stores like Target have lowered their profit forecasts.
Bitcoin Price Prediction: Cautious Optimism With Defined Risk Parameters
In the future, Bitcoin’s price seems to be tightly linked to the state of the economy as a whole and the performance of the tech industry. BTC will have to pass a big test at the $93,500 resistance level in the near future. If prices break above this area with more volume, they could rise to $95,000–$96,200.
If the price doesn’t get back up to $93,500, it will probably challenge the $90,000-$88,500 support range again. If the price drops below $88,500, losses could speed up below $86,500, which could lead to a bigger correction.
The most likely scenario is that Bitcoin will stay between $90,000 and $93,500 for the next few days as traders try to figure out if Nvidia’s earnings are a sign of a turning point for risk assets or just a short break. The stability of the futures market is a good sign for recovery, but for prices to keep going up, macro conditions need to get better and institutional buying through ETF channels needs to start up again.
- Check out our free forex signals
- Follow the top economic events on FX Leaders economic calendar
- Trade better, discover more Forex Trading Strategies
- Open a FREE Trading Account
- Read our latest reviews on: Avatrade, Exness, HFM and XM
Related Articles

Sidebar rates
Related Posts
