Daily Crypto Signals: Bitcoin Slides to $86K, Solana ETFs Attract $476M Despite Market Downturn
Bitcoin plunged to a monthly low of $86,400 amid weakening institutional demand and bearish technical indicators, while spot Solana ETFs
Quick overview
- Bitcoin's price dropped to a monthly low of $86,400 due to weakening institutional demand and bearish technical indicators.
- Solana's newly launched ETFs experienced significant inflows of $476 million over 17 days, contrasting with the overall market decline.
- Despite a brief rally following Nvidia's strong earnings, broader economic uncertainty and reduced Federal Reserve rate cut expectations led to a reversal in crypto market gains.
- Technical analysts are divided on Bitcoin's future, with some predicting a range-bound market while others foresee a potential drop to $30,000.
Bitcoin BTC/USD plunged to a monthly low of $86,400 amid weakening institutional demand and bearish technical indicators, while Solana’s SOL/USD newly launched ETFs bucked the trend with 17 consecutive days of inflows totaling $476 million. Despite a brief rally following Nvidia’s strong earnings report, crypto markets reversed gains as broader economic uncertainty and diminishing Federal Reserve rate cut expectations weighed on digital assets.
Crypto Market Developments
This week, the cryptocurrency market was very volatile since a number of things came together to push down the prices of digital assets. Bitcoin momentarily rose beyond $93,000 after Nvidia announced record third-quarter earnings of $57 billion and profits of $31.9 billion, which were much more than what analysts had expected. But these gains didn’t last long because the market became shaky again.
Changes in regulations were a rare bright spot, as the US Securities and Exchange Commission under Chair Paul Atkins took a much less strict approach to enforcement. Compared to the previous year, total enforcement actions dropped by about 30% in fiscal year 2025. Cases involving crypto saw the biggest drops. The change was a big break from the strict regulatory position that Gary Gensler took, and the dismissal of the Coinbase action in February was a clear indication of how the enforcement mindset was evolving.
Even if regulations were moving in the right direction, institutional demand for cryptocurrencies was clearly dropping. Bitcoin exchange-traded funds saw $27.4 billion in inflows so far this year, which is 52% less than the $41.7 billion they had last year. Corporate treasury buying also slowed down a lot. Strategy’s most recent purchase of 8,178 BTC was its biggest since July, but it was still far lower than prior big acquisitions during the bull market’s high stages.
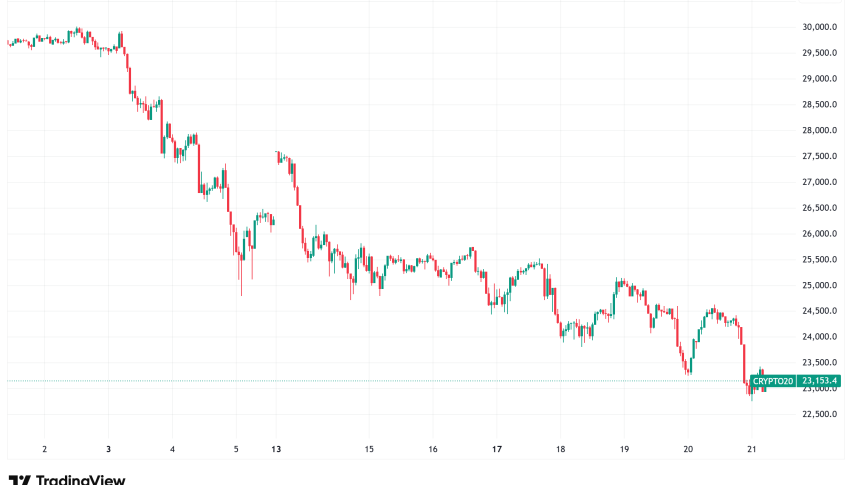
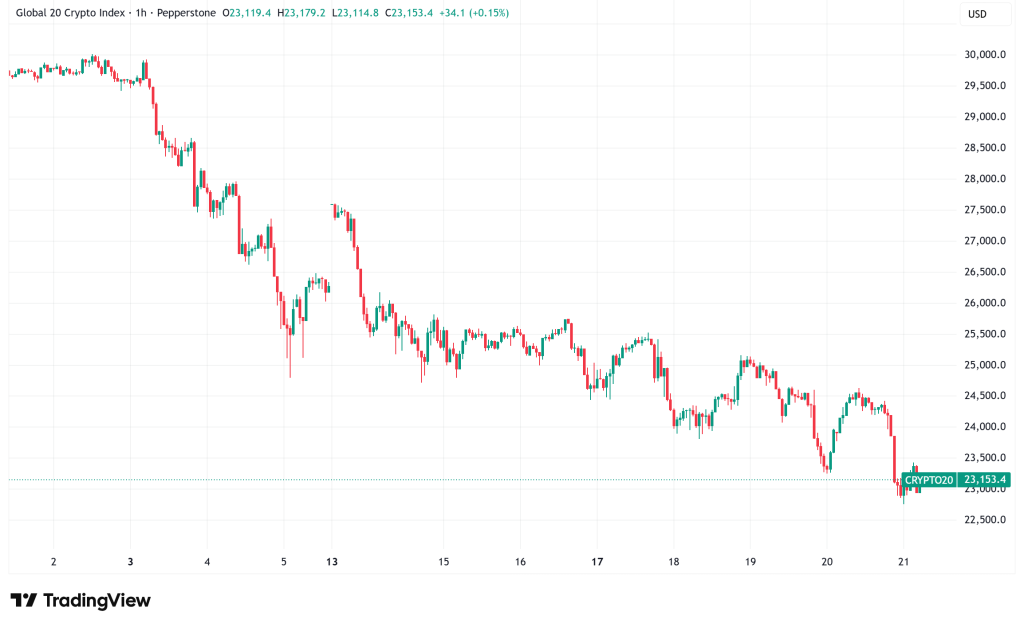
Bitcoin Dips to $86,000, Most Bearish Price Action Since January 2023
CryptoQuant, an analytics platform, says that Bitcoin’s price action has entered the “most bearish” phase of the current bull cycle that started in January 2023. The Bull Score Index for the top cryptocurrency dropped to a very bearish level of 20 out of 100, and prices fell considerably below the important 365-day moving average of $102,000. This technical breakdown is similar to the bearish signal that came before the bear market in 2022, which makes analysts worry that the current bull cycle may have come to an end.
Technical analysts found different stories about where Bitcoin is likely to go in the near future. One group pointed to a bullish reversal fractal that looked like the pattern from the first quarter of 2025, when Bitcoin hit its lowest point following a multi-week fall caused by worries about a trade war, but then it recovered. This analysis suggested that the market will stay in a range between $85,000 and $100,000 for three to four weeks. The weekly relative strength index showed that the market was deeply oversold, which supported the idea that the market would eventually retest the $98,000 to $100,000 resistance levels.
Contrarian voices painted even more negative pictures, with analyst AlejandroBTC pointing out that Bitcoin has broken out of a huge rising wedge pattern. When this classic technical pattern breaks, it usually means that a significant trend is coming to a conclusion. The measured advance suggests a possible long-term goal near $30,000. This kind of big drop would fit with several historical support zones, but it would mean a drop of more than 65% from where we are now.
The technical uncertainty is a sign of bigger worries in the market about the economy as a whole, especially about what the Federal Reserve will do. The chances of a 50-basis-point rate drop at the next Federal Open Market Committee meeting went down, which made people less willing to take risks in both traditional and crypto markets. Bitcoin’s connection to stock market indexes stayed high during the recent turbulence.
Spot Solana ETFs Attract $476 Million in Inflows
Solana (SOL) was a big exception in the overall market slump. Its new spot ETFs were quite good at attracting institutional capital, which is very impressive. The goods brought in a total of $476 million in net inflows during 17 days, even though SOL’s price dropped over 30% from $186 to $130. Bitwise’s BSOL ETF had the most inflows, bringing in $424 million, or 89% of all inflows. On November 19, it set a record for a single day with $35 million.
The steady demand for ETFs was very different from Solana’s falling prices and technical structure. Eric Balchunas, an ETF analyst, said that spot SOL ETFs as a group were able to bring in money “basically every day,” even when the markets were in “extreme fear” zone. With $100 million in assets under management, the 21Shares Solana ETF opened, giving institutions another way to get involved in the ecosystem.
But data from on-chain and futures markets made SOL’s short-term outlook look less bright. Solana did better than Bitcoin, Ethereum, and XRP for a short time on Thursday, but the surge immediately stopped around the 50-period exponential moving average around $140. There was no new long interest from leveraged traders throughout the move from $130 to $140, which means that the rally didn’t have any new long traders.
Cumulative volume delta measurements showed that both the futures and spot markets fell sharply throughout the attempted rebound, which was more worrying. Open interest rose sharply as prices stabilized near the $140 barrier level. This suggests that new short positions were being opened instead of new bullish wagers. Even after the price fell back to $130, funding rates stayed high, which meant that leveraged long positions were still crowded and at risk of more liquidations. Analysts pointed out that $120 is the next important downside objective, where liquidity and a daily order block meet. Sellers will stay in control unless SOL can forcefully climb back to the $140 level.
- Check out our free forex signals
- Follow the top economic events on FX Leaders economic calendar
- Trade better, discover more Forex Trading Strategies
- Open a FREE Trading Account