Ethereum Stabilizes Around $2,900 as Technical Indicators Signal Potential Recovery Ahead
Ethereum (ETH) is currently trading at $2,900, which is a sign of relative stability after a rough patch when the cryptocurrency dropped

Quick overview
- Ethereum is currently trading at $2,900, showing signs of recovery after a significant drop from its November highs.
- Technical indicators suggest bullish momentum, with ETH breaking key resistance levels and finding support around $2,623.
- Major resistance levels at $2,980 and $3,000 need to be overcome for a potential rally towards $3,150 or higher.
- Onchain fundamentals present mixed signals, with lower transfer volumes and the upcoming Fusaka upgrade potentially impacting token value.
Ethereum ETH/USD is currently trading at $2,900, which is a sign of relative stability after a rough patch when the cryptocurrency dropped more than 18% from its November highs. The second-largest cryptocurrency by market cap is starting to show signs of recovery as technical indicators start to turn bullish. However, there are still major resistance levels ahead.

ETH/USD Technical Recovery Gains Momentum Above Key Support Levels
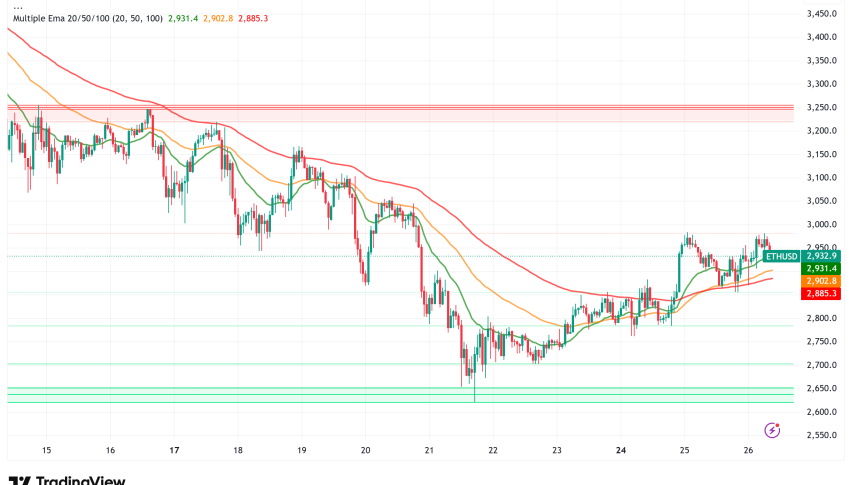
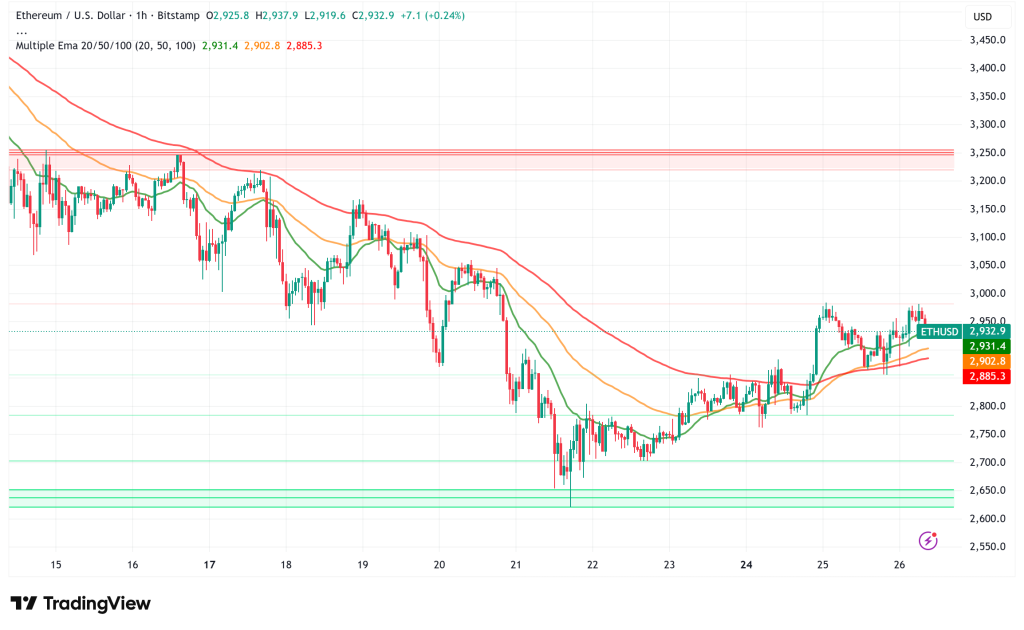
After finding strong support near the $2,623 level on Friday, which is the 61.8% Fibonacci retracement level at $2,749, ETH has started to recover. The cryptocurrency has gone up almost 7% in the last three days, breaking through the $2,850 and $2,880 levels and setting itself above the 100-hourly Simple Moving Average.
When ETH broke through a significant negative trend line with resistance around $2,950, it was a major turning point. The price has gone above the 76.4% Fibonacci retracement line of the latest drop from the $3,058 swing high to the $2,620 low. This suggests that positive momentum is getting stronger.
The hourly MACD and RSI indicators both show that things are looking well. The MACD is getting stronger in the bullish zone, while the RSI has gone above the neutral 50 mark. More importantly, the RSI is bouncing back from oversold area on the daily time frame. This is similar to Bitcoin’s recent recovery, which suggests that selling pressure may be running out. On Tuesday, the MACD indicator also showed a bullish crossover, which was another purchase signal that supports the idea of a comeback.
Key Resistance and Support Levels Define Trading Range
Ethereum has to break through a few big resistance levels in order for bulls to stay in charge. The first problem is at $2,980, and the next one is at the psychologically crucial $3,000 level. If ETH breaks above this zone, it might quickly move toward the first significant resistance level around $3,060. The daily resistance level of $3,017 and the 50-day EMA at $3,483 are also potential upside objectives.
If the market stays strong above $3,060, it might lead to a rally toward $3,150. If the momentum keeps going, it could possibly reach $3,220 or $3,250 in the near future.
But if the price doesn’t break over the $3,000 resistance, selling pressure could start up again. The first level of support on the downside is $2,920, and the main level of support is $2,880. If ETH breaks below these levels, it will probably go back to $2,800 and maybe even test the previous lows of $2,740 and $2,620 again.
Ethereum Ecosystem Developments and Market Activity Show Mixed Signals
Ethereum’s onchain fundamentals tell a more complicated story, even though there are signs of a technical revival. Network activity has showed lower transfer volumes and fee revenue, which could mean that the market is becoming more stable and less speculative. Many short-term holders are still underwater, which is important because their profits are still low.
On a more positive side, the planned Fusaka upgrade in December is projected to greatly improve token value capture, even though not many people in the community are talking about it. Lighter, a decentralized exchange on Ethereum Layer 2 that doesn’t charge fees, is also gaining popularity and showing that it has advantages over centralized platforms.
Ethereum Price Prediction: Cautious Optimism with $3,000 as Critical Threshold
Ethereum looks like it could break out in the next few weeks based on current technical signs and how the market is moving. The base case scenario is that ETH might test the $3,000-$3,060 resistance zone in the next 7 to 10 days. If it breaks through, prices could rise to the $3,150-$3,220 region.
Traders should still be careful, though. To keep the positive momentum going, the cryptocurrency must stay above $2,880. If this level can’t be held, it might lead to a retest of the Fibonacci support level at $2,749 or lower levels around $2,620. The conclusion of the battle at $3,000 will probably decide whether Ethereum starts a long-term recovery or stays in a range until the end of the year.
- Check out our free forex signals
- Follow the top economic events on FX Leaders economic calendar
- Trade better, discover more Forex Trading Strategies
- Open a FREE Trading Account


