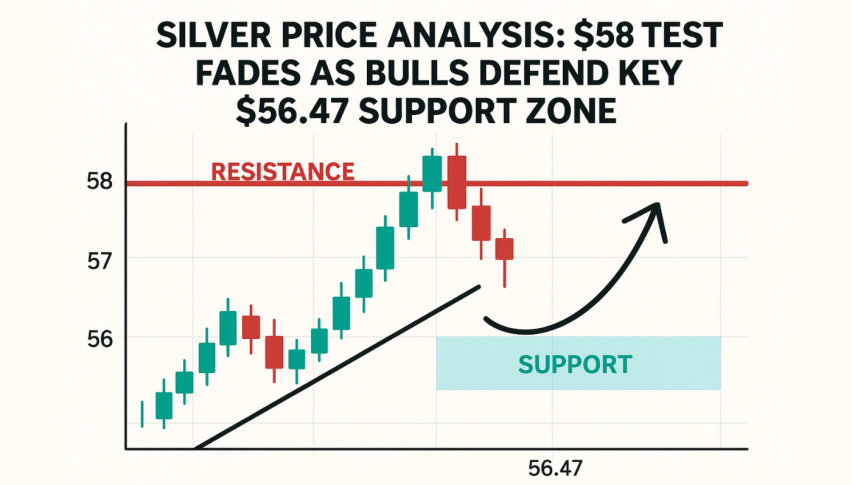
Silver Price Analysis: $58 Test Fades as Bulls Defend Key $56.47 Support Zone
Silver is stabilizing near $57.00 after last week’s sharp rally, with price action now signaling a cooling phase rather than a full reversal
Quick overview
- Silver is stabilizing around $57.00 after a recent rally, indicating a cooling phase rather than a full reversal.
- The broader uptrend remains intact, with higher lows supported by a rising trendline and the 20-EMA acting as dynamic support.
- A bullish breakout is likely if silver closes above $58.00, while a drop below $54.97 could signal a trend reversal.
- The next significant candle will be crucial in determining whether silver will push towards $60 or enter a broader correction.
Silver is stabilizing near $57.00 after last week’s sharp rally, with price action now signaling a cooling phase rather than a full reversal. The metal slipped from the $58.89 swing high into the 23.6% Fibonacci retracement at $56.47, an area that has already attracted dip-buyers. Recent candles include spinning tops and small doji formations, showing hesitation on both sides as traders reassess near-term direction.
Uptrend Structure Holding
Despite the pullback, the broader structure remains constructive. Silver continues to form higher lows, supported by a rising trendline that has guided the rally since mid-November. The 20-EMA at $55.96 is acting as dynamic support, keeping momentum tilted upward. RSI has eased from overbought territory but is still hovering above 63, showing buyers maintain control without exhibiting bearish divergence.
Silver (XAG/USD) Breakout Levels to Watch
A renewed bullish push becomes more convincing if silver closes back above $58.00, ideally with a strong candle such as a bullish engulfing pattern or even a three-white-soldiers formation. That type of follow-through would confirm returning momentum and open the path toward $60.36, the next key resistance on the chart.
Traders often wait for this kind of confirmation because it shows that buyers are willing to defend the trend and push the market into a fresh leg higher.
Silver (XAG/USD) Downside Risk Zones
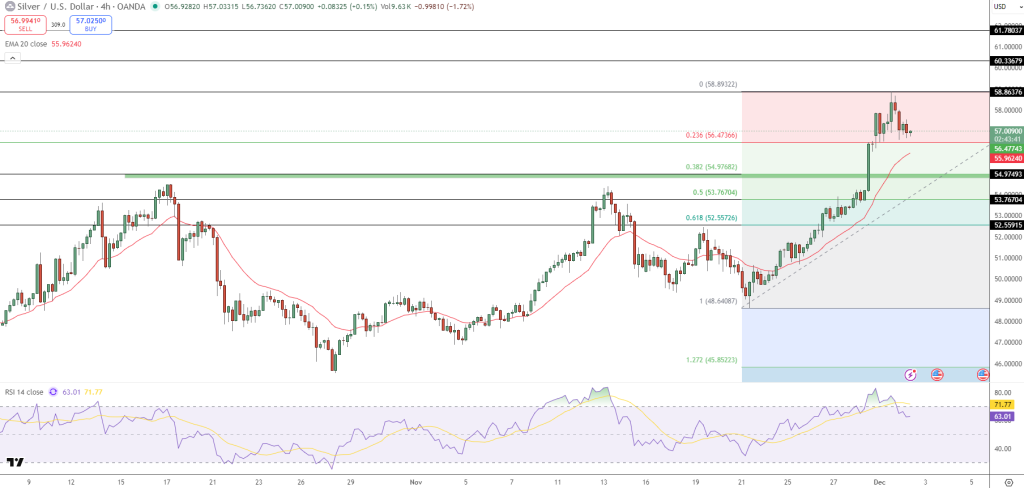
A break below the 38.2% Fib at $54.97 would weaken the sequence of higher lows and shift attention toward the 50% retracement at $53.76. This is where bulls would need to regroup to prevent a deeper structural breakdown.
Key risk levels:
- $58.00: Bullish breakout trigger
- $56.47: Immediate support
- $54.97: Trend-break threshold
- $60.36: Next bullish target
Conclusion
Silver remains in an upward trajectory, but momentum is pausing as traders digest last week’s surge. The next meaningful candle—bullish or bearish—will determine whether the market gears up for another push toward $60+ or slips into a broader correction.
- Check out our free forex signals
- Follow the top economic events on FX Leaders economic calendar
- Trade better, discover more Forex Trading Strategies
- Open a FREE Trading Account
- Read our latest reviews on: Avatrade, Exness, HFM and XM
Related Articles

Sidebar rates
Related Posts
